Introduction
Gantt charts have long been a staple tool for planning and tracking project timelines. These visual representations of project schedules allow project managers to outline tasks, allocate resources, and monitor progress effectively. By displaying tasks along a timeline, Gantt charts provide a clear overview of project phases, dependencies, and deadlines, making them invaluable for ensuring that projects stay on track and within budget.
However, as project management methodologies evolve, particularly with the rise of Agile practices, the traditional Gantt chart is being re-evaluated. Agile methodologies emphasize flexibility, collaboration, and iterative progress, contrasting sharply with the linear and structured nature of traditional project management approaches. Agile focuses on delivering value through adaptive planning and continuous improvement, which can sometimes make the rigid framework of a traditional Gantt chart seem less applicable.
This blog post aims to explore the differences between Agile Gantt charts and traditional Gantt charts, highlighting their respective benefits and suitability for various project types. By examining these two methodologies, project managers and team leaders can better understand which approach aligns with their project goals and team dynamics. Whether you are managing a software development project that requires rapid iterations or a construction project that demands strict adherence to timelines, understanding the strengths and weaknesses of each Gantt chart type will empower you to make informed decisions that enhance project success.
Understanding Traditional Gantt Charts
Traditional Gantt charts are a widely used project management tool that visually represents project schedules, making it easier for project managers and team leaders to plan, coordinate, and track tasks. Here’s a detailed look at their structure, benefits, and limitations.
Structure of Traditional Gantt Charts
- Tasks: Each task or activity in a project is represented as a horizontal bar on the chart. The length of the bar corresponds to the duration of the task, allowing for a clear view of how long each task is expected to take.
- Timelines: The horizontal axis of the Gantt chart typically represents time, which can be broken down into days, weeks, or months, depending on the project’s scale. This timeline helps in understanding when tasks are scheduled to start and finish.
- Dependencies: Traditional Gantt charts often include arrows or lines that connect tasks, indicating dependencies. This means that some tasks cannot start until others are completed, which is crucial for understanding the sequence of activities and potential bottlenecks.
Benefits of Traditional Gantt Charts
- Clear Visualization of Project Timelines: Gantt charts provide a straightforward visual representation of the project timeline, making it easy for stakeholders to see the overall schedule at a glance. This clarity helps in communicating project status to team members and clients alike.
- Tracking Progress: As tasks are completed, project managers can update the Gantt chart to reflect progress. This allows for real-time tracking of how much of the project has been completed versus what remains, facilitating better decision-making.
- Resource Allocation: Gantt charts help in identifying which resources (team members, equipment, etc.) are assigned to specific tasks. This visibility aids in optimizing resource allocation and ensuring that team members are not overburdened or underutilized.
Limitations of Traditional Gantt Charts
- Inflexibility to Changes: One of the significant drawbacks of traditional Gantt charts is their rigidity. Once a project plan is set, any changes in scope, timelines, or resources can require substantial reworking of the chart, which can be time-consuming and cumbersome.
- Challenges in Dynamic Environments: In fast-paced or agile environments, where project requirements can change frequently, traditional Gantt charts may struggle to keep up. They are often not designed to accommodate iterative processes or rapid adjustments, which can lead to outdated information.
- Potential for Complexity in Large Projects: For large projects with numerous tasks and dependencies, Gantt charts can become overly complex and difficult to read. This complexity can obscure important details and make it challenging for team members to understand their roles and responsibilities.
Exploring Agile Gantt Charts
Agile Gantt Charts represent a modern evolution of the traditional Gantt chart, tailored to fit the dynamic and iterative nature of Agile project management. They integrate Agile principles, emphasizing flexibility and continuous improvement, making them a valuable tool for project managers and team leaders navigating complex projects.
Definition and Integration of Agile Principles
Agile Gantt Charts are visual project management tools that combine the timeline and task dependencies of traditional Gantt charts with Agile methodologies. They allow teams to plan, track, and manage projects in a way that accommodates the iterative cycles of Agile development. Key characteristics include:
- Flexibility: Agile Gantt Charts are designed to adapt to changes in project scope or direction. Unlike traditional Gantt charts, which often lock teams into a fixed schedule, Agile Gantt Charts allow for adjustments as new information or requirements emerge.
- Iterative Development: These charts support the Agile practice of breaking projects into smaller, manageable increments or sprints. Each sprint can be represented on the Gantt chart, allowing teams to visualize progress and plan future iterations effectively.
Differences from Traditional Gantt Charts
While both Agile and traditional Gantt charts serve the purpose of project planning and tracking, they differ significantly in structure and use:
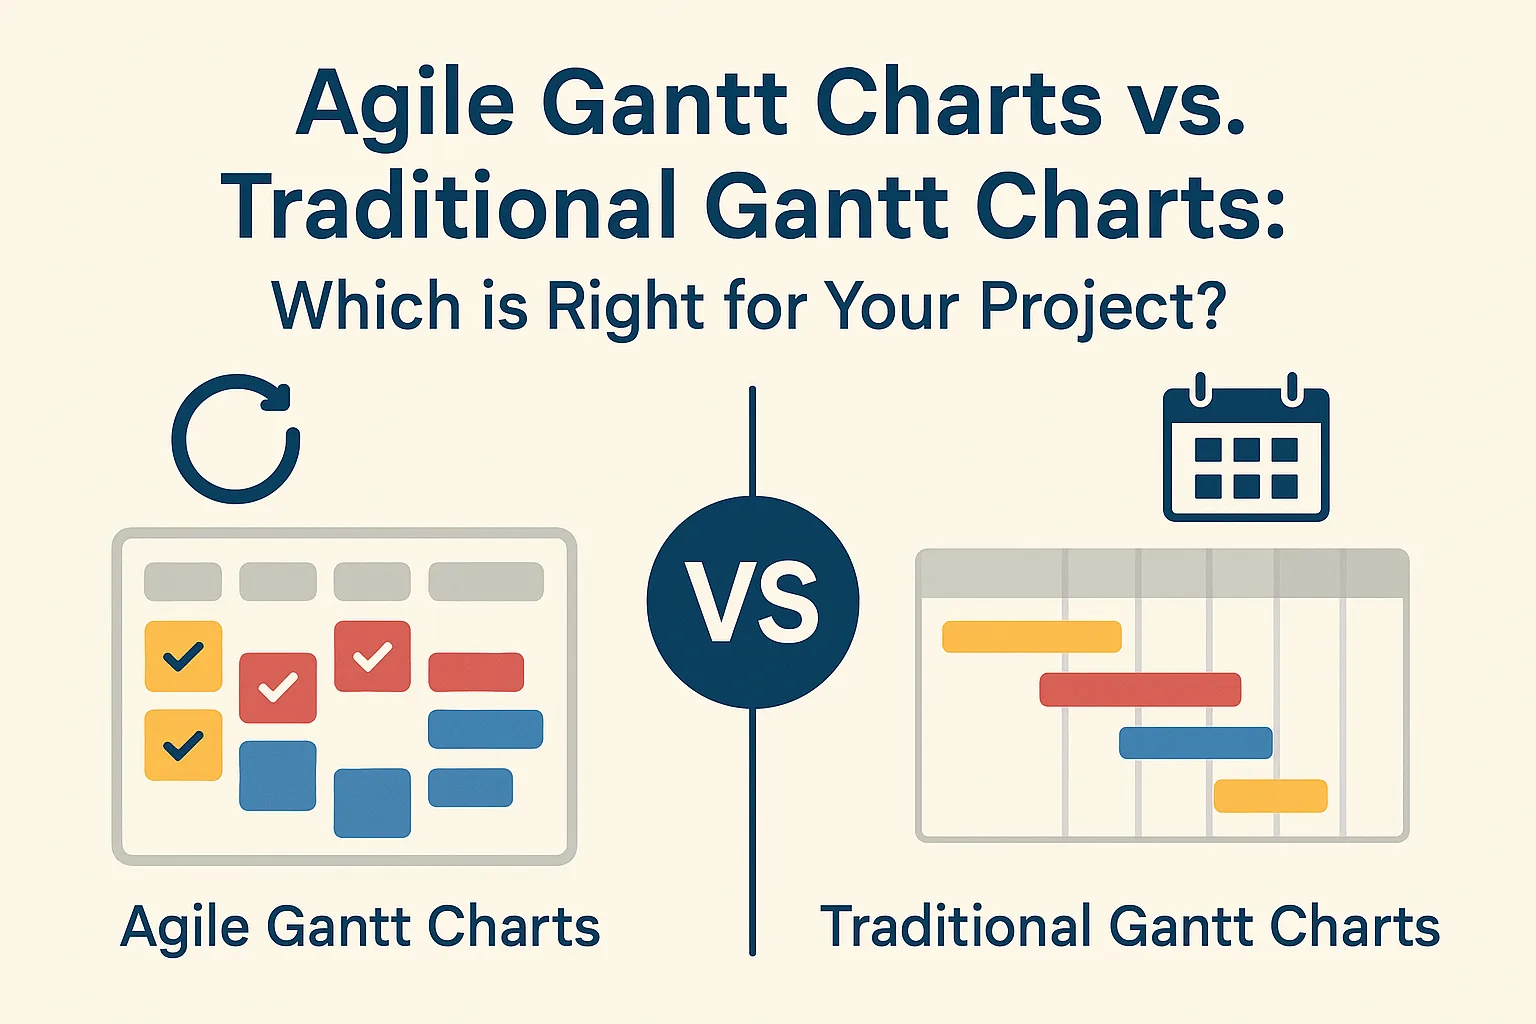
- Structure: Traditional Gantt charts typically present a linear timeline with fixed start and end dates for tasks, which can lead to rigidity. In contrast, Agile Gantt Charts often feature overlapping tasks and flexible timelines that reflect the iterative nature of Agile projects.
- Use: Traditional Gantt charts are often used in waterfall project management, where tasks are sequential and dependencies are strictly defined. Agile Gantt Charts, however, are utilized in environments where collaboration and adaptability are paramount, allowing teams to respond quickly to changes and feedback.
Benefits of Agile Gantt Charts
Agile Gantt Charts offer several advantages that align with the needs of modern project management:
- Adaptability to Changes: The inherent flexibility of Agile Gantt Charts allows teams to pivot quickly in response to new challenges or opportunities, ensuring that project goals remain aligned with stakeholder expectations.
- Real-Time Progress Tracking: These charts facilitate real-time updates, enabling teams to monitor progress continuously. This transparency helps identify bottlenecks early and fosters proactive problem-solving.
- Focus on Team Collaboration and Communication: Agile Gantt Charts promote collaboration by visualizing tasks and dependencies in a way that encourages team members to engage with one another. This collaborative approach enhances communication, ensuring that everyone is aligned and informed throughout the project lifecycle.
Key Differences Between Agile Gantt Charts and Traditional Gantt Charts
When it comes to project management, choosing the right tool can significantly impact the success of a project. Agile Gantt charts and traditional Gantt charts represent two distinct methodologies, each with its own strengths and weaknesses. Understanding their key differences can help project managers and team leaders determine which approach is best suited for their specific needs.
1. Project Planning Approaches: Linear vs. Iterative
- Traditional Gantt Charts: These charts follow a linear project planning approach, where tasks are sequenced in a strict order. Each task must be completed before the next one begins, making it ideal for projects with well-defined requirements and minimal changes. This method is often used in industries like construction and manufacturing, where timelines and deliverables are predictable.
- Agile Gantt Charts: In contrast, Agile Gantt charts embrace an iterative approach. They allow for flexibility and adaptability, accommodating changes in project scope and requirements as they arise. This is particularly beneficial in dynamic environments such as software development, where customer feedback and evolving needs can lead to frequent adjustments in project direction.
2. Timeline Flexibility and Adjustments
- Traditional Gantt Charts: These charts typically have fixed timelines, making it challenging to accommodate changes once the project is underway. Adjustments often require significant re-planning and can disrupt the entire project schedule. This rigidity can lead to delays and increased costs if unexpected issues arise.
- Agile Gantt Charts: Agile methodologies prioritize flexibility, allowing teams to adjust timelines and tasks as needed. Agile Gantt charts can be updated in real-time, reflecting changes in priorities or project scope. This adaptability helps teams respond quickly to new information or challenges, ultimately leading to more efficient project execution.
3. Impact on Team Dynamics: Collaboration vs. Individual Accountability
- Traditional Gantt Charts: The linear nature of traditional Gantt charts often fosters a culture of individual accountability. Team members are assigned specific tasks with clear deadlines, which can lead to a focus on individual performance rather than collaboration. While this can drive accountability, it may also create silos within the team, hindering communication and collaboration.
- Agile Gantt Charts: Agile methodologies emphasize collaboration and teamwork. Agile Gantt charts facilitate communication among team members, encouraging them to work together towards common goals. This collaborative environment fosters innovation and problem-solving, as team members can share insights and feedback throughout the project lifecycle.
When to Use Traditional Gantt Charts
Traditional Gantt charts have long been a staple in project management, providing a visual timeline for project tasks and milestones. While Agile methodologies have gained popularity, there are specific scenarios where traditional Gantt charts remain the most effective tool for project managers and team leaders. Here are key points to consider when determining the appropriateness of traditional Gantt charts for your projects:
- Fixed Scope and Timelines: Traditional Gantt charts excel in environments where project scope and timelines are clearly defined and unlikely to change. This rigidity allows for precise planning and scheduling, making it easier to track progress against predetermined deadlines. Projects with fixed deliverables benefit from the structured nature of Gantt charts, as they provide a clear roadmap for all stakeholders involved.
- Regulatory Compliance and Documentation: Industries that require strict adherence to regulatory standards often find traditional Gantt charts indispensable. Sectors such as healthcare, finance, and construction necessitate detailed documentation and compliance tracking. Gantt charts facilitate this by offering a comprehensive overview of project phases, ensuring that all necessary documentation is completed and reviewed at each stage.
- Structured Approach for Complex Projects: Certain projects, particularly in construction and manufacturing, thrive under a structured approach. Traditional Gantt charts allow project managers to break down complex tasks into manageable components, assign resources, and monitor dependencies. For instance, in construction, where tasks are interdependent (e.g., foundation work must be completed before framing can begin), Gantt charts provide clarity on timelines and resource allocation, ensuring that each phase is executed in a timely manner.
- Stakeholder Communication: Traditional Gantt charts serve as an effective communication tool for stakeholders who prefer a linear representation of project timelines. They provide a straightforward visual that can be easily understood by team members, clients, and upper management, facilitating discussions around project status and timelines.
When to Use Agile Gantt Charts
Agile Gantt charts represent a modern adaptation of traditional Gantt charts, tailored to meet the dynamic needs of project management in environments that require flexibility and rapid iteration. Here are some scenarios where Agile Gantt charts prove to be more effective:
- Frequent Adjustments and Iterations: Agile Gantt charts are particularly beneficial for projects that necessitate regular changes and updates. In environments where requirements evolve based on stakeholder feedback or market conditions, these charts allow teams to visualize progress while accommodating ongoing modifications. This adaptability ensures that project timelines remain relevant and aligned with current objectives.
- Industries Focused on Innovation: Sectors such as software development, technology startups, and creative industries thrive on innovation and rapid development cycles. Agile Gantt charts facilitate a more iterative approach, enabling teams to break down projects into manageable sprints. This method not only enhances productivity but also fosters a culture of continuous improvement, allowing teams to pivot quickly in response to new ideas or challenges.
- Projects Emphasizing Team Collaboration: Agile Gantt charts are ideal for projects that rely heavily on collaboration among team members. By providing a visual representation of tasks and timelines, these charts enhance communication and transparency within the team. They allow for real-time updates and adjustments, ensuring that all team members are aligned and aware of their responsibilities. This collaborative approach is essential in projects where cross-functional teams must work together to achieve common goals.
Conclusion
The choice between Agile Gantt Charts and Traditional Gantt Charts can significantly impact the success of a project. Here’s a recap of the main differences and benefits of each methodology:
- Traditional Gantt Charts are linear and structured, making them ideal for projects with well-defined scopes and timelines. They provide a clear visual representation of tasks, dependencies, and deadlines, which is beneficial for projects that require strict adherence to schedules. Their strengths lie in:
- Predictability: They allow for detailed planning and forecasting, which is essential for projects with fixed requirements.
- Stakeholder Communication: They serve as effective tools for communicating progress to stakeholders who prefer a straightforward, timeline-based view of project status.
- Agile Gantt Charts, on the other hand, embrace flexibility and adaptability, aligning well with projects that require iterative development and frequent reassessment. They are particularly beneficial for:
- Dynamic Environments: Agile Gantt Charts accommodate changes in project scope and priorities, making them suitable for projects in fast-paced industries.
- Team Collaboration: They foster collaboration and communication within teams, as they often incorporate feedback loops and allow for adjustments based on team input.
When deciding which methodology to adopt, project managers and team leaders should carefully assess their project needs and team dynamics. Consider the following factors:
- Project Complexity: For complex projects with evolving requirements, Agile Gantt Charts may provide the necessary flexibility. Conversely, for straightforward projects with clear objectives, Traditional Gantt Charts may be more effective.
- Team Structure: Evaluate whether your team thrives in a structured environment or prefers a more fluid approach. Agile methodologies often benefit from collaborative teams that can adapt quickly to changes.
Find out more about Shaun Stoltz https://www.shaunstoltz.com/about/.
This post was written by an AI and reviewed/edited by a human.