Introduction to Project Timelines
Project timelines serve as a critical framework that outlines the sequence of tasks and milestones necessary for successful project completion. These timelines are not merely schedules; they are essential tools that help project managers and teams visualize the entire project lifecycle, ensuring that all components are aligned and progressing as planned.
Definition and Significance of Project Timelines
A project timeline is a visual representation that delineates the start and end dates of various project tasks, along with their interdependencies. It provides a clear roadmap for project execution, allowing stakeholders to understand the flow of activities and the time allocated for each phase. The significance of project timelines can be summarized as follows:
- Clarity and Focus: Timelines help in clarifying the project scope and objectives, ensuring that all team members are on the same page regarding deadlines and deliverables.
- Resource Allocation: By visualizing the timeline, project managers can allocate resources more effectively, ensuring that the right personnel and materials are available when needed.
- Progress Tracking: Timelines facilitate ongoing monitoring of project progress, enabling teams to identify delays and adjust plans proactively.
The Role of Effective Planning in Minimizing Risks
Effective planning is paramount in project management, particularly when it comes to risk management. A well-structured timeline allows project managers to anticipate potential challenges and devise strategies to mitigate them. Key aspects of effective planning include:
- Identifying Risks Early: By mapping out the project timeline, managers can identify critical paths and potential bottlenecks, allowing for early intervention.
- Contingency Planning: Timelines enable the development of contingency plans for high-risk areas, ensuring that teams are prepared to address issues as they arise.
- Stakeholder Communication: A clear timeline fosters better communication among stakeholders, ensuring that everyone is aware of potential risks and the strategies in place to manage them.
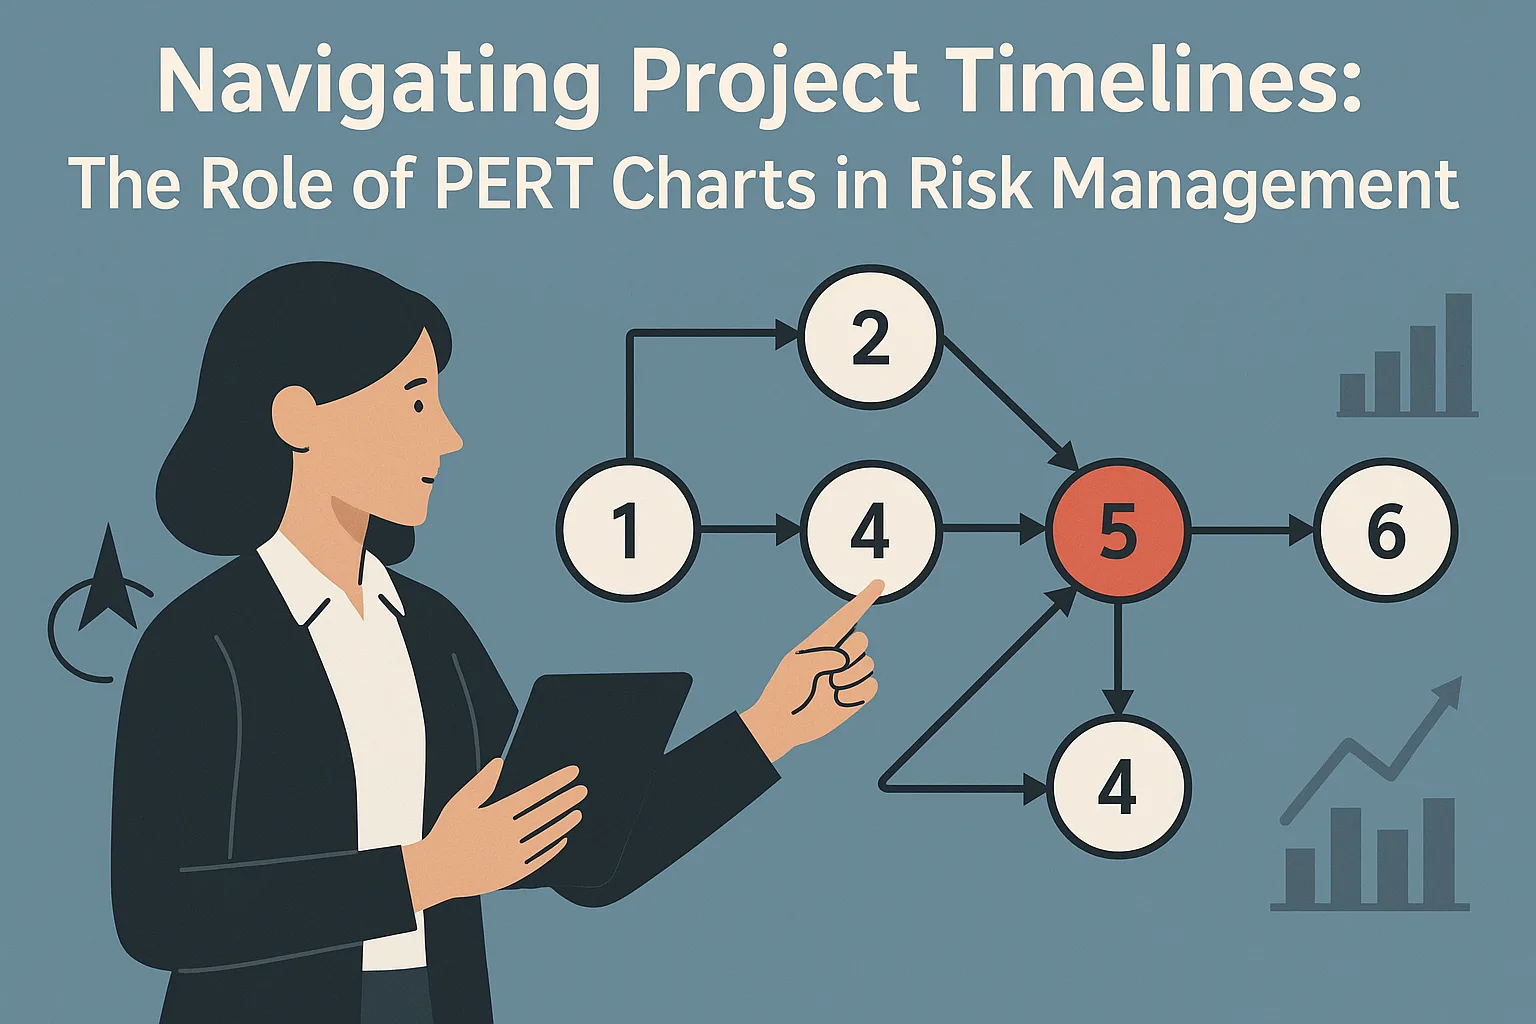
Introducing PERT Charts as a Tool for Visualizing Project Timelines
One of the most effective tools for visualizing project timelines and assessing risks is the Program Evaluation and Review Technique (PERT) chart. PERT charts are designed to analyze the tasks involved in completing a project, particularly when the time required to complete each task is uncertain. They offer several advantages:
- Visual Clarity: PERT charts provide a graphical representation of project tasks and their interdependencies, making it easier to understand complex project timelines.
- Focus on Time Estimates: By incorporating optimistic, pessimistic, and most likely time estimates for each task, PERT charts help project managers assess the potential variability in project timelines.
- Risk Assessment: The use of PERT charts allows for a more nuanced understanding of risks associated with project timelines, enabling managers to prioritize risk mitigation efforts effectively.
Understanding PERT Charts
Effective planning and risk assessment are crucial for the successful completion of projects. One of the most valuable tools for achieving this is the PERT chart, or Program Evaluation and Review Technique chart. This section will delve into the definition, components, and visualization capabilities of PERT charts, highlighting their significance in risk management.
Definition of PERT Charts
PERT charts are a project management tool used to analyze and represent the tasks involved in completing a project. Developed in the 1950s for the U.S. Navy’s Polaris submarine project, PERT charts facilitate the planning and coordination of complex projects by providing a visual representation of the project timeline and task dependencies. They are particularly useful in projects where time is a critical factor, allowing project managers to identify the minimum time required to complete the entire project.
Components of PERT Charts
A PERT chart consists of several key components that work together to provide a comprehensive overview of a project:
- Tasks: Each task represents a specific activity that must be completed as part of the project. Tasks are typically denoted by a node or a circle in the chart.
- Durations: This refers to the estimated time required to complete each task. In PERT charts, durations are often expressed in terms of optimistic, pessimistic, and most likely estimates, allowing for a more nuanced understanding of timeframes.
- Dependencies: These are the relationships between tasks, indicating which tasks must be completed before others can begin. Dependencies are crucial for understanding the sequence of activities and identifying potential bottlenecks in the project timeline.
Visualization of Project Tasks and Timelines
One of the primary advantages of PERT charts is their ability to visualize project tasks and timelines effectively. The chart typically displays tasks as nodes connected by arrows that represent the flow of the project. This visual representation allows project managers to:
- Identify Critical Paths: By analyzing the longest sequence of dependent tasks, project managers can determine the critical path, which is essential for understanding which tasks directly impact the project’s completion time.
- Assess Risks: PERT charts enable risk managers to identify potential delays and assess the impact of uncertainties in task durations. By visualizing dependencies and timelines, they can better prepare for risks that may arise during project execution.
- Facilitate Communication: The clear visual format of PERT charts makes it easier for project teams and stakeholders to understand the project’s structure and progress, fostering better communication and collaboration.
The Importance of Risk Management in Project Planning
Risk management is a critical component that ensures the successful delivery of projects. It involves identifying, assessing, and prioritizing risks followed by coordinated efforts to minimize, monitor, and control the probability or impact of unfortunate events. Effective risk management is not just a safety net; it is a proactive approach that enhances decision-making and project outcomes.
Definition and Relevance of Risk Management
- Definition: Risk management is the systematic process of identifying potential risks that could negatively impact a project, analyzing their potential consequences, and implementing strategies to mitigate or eliminate these risks. This process is essential for maintaining project timelines, budgets, and quality standards.
- Relevance to Project Planning: In project planning, risk management is vital as it helps project managers anticipate challenges and prepare for them. By integrating risk management into the planning phase, teams can develop contingency plans, allocate resources more effectively, and enhance stakeholder confidence in the project’s success.
Common Risks Faced in Project Management
Project managers encounter various risks that can derail project objectives. Some of the most common risks include:
- Scope Creep: This occurs when the project’s scope expands beyond its original objectives, often leading to increased costs and extended timelines.
- Resource Availability: Unforeseen changes in resource availability, whether human or material, can significantly impact project schedules and deliverables.
- Technological Changes: Rapid advancements in technology can render project tools or processes obsolete, necessitating adjustments that may not have been planned for.
- Stakeholder Engagement: Lack of stakeholder involvement or conflicting interests can lead to miscommunication and project misalignment.
Consequences of Ignoring Risk Assessment in Project Planning
Neglecting risk assessment can have dire consequences for any project. Some of the potential outcomes include:
- Increased Costs: Without proper risk management, projects may face unexpected expenses due to unanticipated issues, leading to budget overruns.
- Missed Deadlines: Ignoring risks can result in delays as teams scramble to address problems that could have been foreseen and mitigated.
- Compromised Quality: When risks are not managed, the quality of deliverables may suffer as teams rush to meet deadlines or cut corners to stay within budget.
- Stakeholder Dissatisfaction: Failing to address risks can lead to unmet expectations, resulting in dissatisfaction among stakeholders and potential damage to the organization’s reputation.
Integrating PERT Charts in Risk Assessment
Effective risk assessment is crucial for ensuring project success. One of the most valuable tools for risk managers and project planners is the Program Evaluation and Review Technique (PERT) chart. This section explores how PERT charts can be integrated into risk assessment processes, providing insights into potential risks, visualizing critical paths, and facilitating scenario planning.
Identifying Potential Risks Through Task Dependencies and Timelines
PERT charts are instrumental in identifying potential risks by mapping out task dependencies and timelines. By breaking down a project into its individual tasks and illustrating how these tasks are interconnected, PERT charts allow project managers to pinpoint where delays or issues may arise.
- Task Dependencies: Each task in a PERT chart is linked to others, creating a network of dependencies. This visualization helps in understanding which tasks are critical to the project’s timeline and which can be delayed without affecting the overall schedule. Identifying these dependencies is essential for risk managers, as it highlights areas where risks may emerge if a task is delayed or fails to meet its objectives.
- Timelines: The estimated time for each task is represented in the PERT chart, allowing project planners to assess the overall project duration. By analyzing these timelines, risk managers can identify tasks that are at risk of overrunning their estimates, enabling proactive risk mitigation strategies.
Visualizing Critical Paths and Identifying Bottlenecks
One of the key advantages of PERT charts is their ability to visualize the critical path of a project. The critical path is the longest sequence of dependent tasks that determines the minimum project duration. Understanding this path is vital for effective risk management.
- Critical Path Visualization: By highlighting the critical path within a PERT chart, project managers can focus their attention on the tasks that directly impact project completion. This focus allows for more effective resource allocation and prioritization of risk management efforts.
- Identifying Bottlenecks: PERT charts also help in identifying potential bottlenecks in the project workflow. By analyzing the flow of tasks and their dependencies, risk managers can spot areas where delays are likely to occur. This foresight enables teams to implement contingency plans or allocate additional resources to mitigate these risks before they impact the project timeline.
Enabling Scenario Planning and Assessing Project Variability
Another significant benefit of PERT charts is their role in scenario planning. By allowing project managers to visualize different project timelines based on varying assumptions, PERT charts facilitate a deeper understanding of project variability.
- Scenario Planning: Risk managers can use PERT charts to create multiple scenarios based on different task completion times. For instance, by adjusting the estimated durations of tasks, teams can simulate best-case, worst-case, and most likely scenarios. This flexibility helps in preparing for uncertainties and developing robust risk management strategies.
- Assessing Project Variability: The variability in task durations can significantly impact project outcomes. PERT charts enable project planners to assess this variability by providing a clear visual representation of how changes in one task can affect the overall project timeline. This assessment is crucial for making informed decisions and preparing for potential risks.
Benefits of Using PERT Charts for Risk Managers and Project Planners
The utilization of PERT (Program Evaluation Review Technique) charts can significantly enhance the effectiveness of risk assessment and project execution. Here are some key benefits that PERT charts offer:
- Improved Clarity: PERT charts provide a visual representation of project tasks and their interdependencies, which helps in clarifying the sequence of activities. This clarity allows risk managers to identify critical paths and potential bottlenecks, making it easier to foresee risks associated with project delays or resource allocation issues.
- Enhanced Communication: By presenting complex project timelines in a straightforward graphical format, PERT charts facilitate better communication among team members and stakeholders. This visual tool ensures that everyone involved has a shared understanding of project timelines and responsibilities, reducing the likelihood of miscommunication and errors.
- Better Decision-Making: The structured layout of PERT charts aids project planners in making informed decisions. By analyzing the relationships between tasks and their durations, planners can evaluate the impact of potential risks and make adjustments to timelines or resources proactively. This capability is crucial for effective risk management, as it allows for timely interventions.
- Streamlined Collaboration Among Stakeholders: PERT charts serve as a common reference point for all stakeholders involved in a project. This shared visual tool fosters collaboration by enabling team members to discuss progress, address concerns, and align their efforts towards common goals. The collaborative environment created by PERT charts can lead to more innovative solutions to potential risks.
- More Accurate Project Forecasting: One of the significant advantages of PERT charts is their ability to improve project forecasting accuracy. By incorporating optimistic, pessimistic, and most likely time estimates for each task, PERT charts allow project managers to calculate expected durations and assess the probability of meeting deadlines. This level of detail is invaluable for risk managers who need to prepare for uncertainties and develop contingency plans.
Challenges and Limitations of PERT Charts
While PERT (Program Evaluation Review Technique) charts are valuable tools in project management, particularly for risk assessment and timeline visualization, they come with several challenges and limitations that risk managers and project planners should consider. Understanding these drawbacks can help in making informed decisions about when and how to use PERT charts effectively.
1. Complexity in Large Projects
- Overwhelming Detail: In large-scale projects, PERT charts can become excessively complex. The sheer volume of tasks and dependencies can lead to charts that are difficult to read and interpret. This complexity can obscure critical information, making it challenging for project managers to identify key risks and timelines effectively.
- Cognitive Overload: As the number of tasks increases, the cognitive load on team members can also rise. Stakeholders may struggle to grasp the overall project status or the implications of specific risks, leading to potential miscommunication and oversight.
2. Need for Continuous Updates
- Dynamic Nature of Projects: Projects are often subject to changes due to various factors such as resource availability, stakeholder input, or unforeseen risks. PERT charts require regular updates to remain relevant, which can be time-consuming and may lead to outdated information if not managed properly.
- Resource Intensive: Maintaining an accurate PERT chart can demand significant resources, including time and personnel. This can detract from other critical project management activities, especially in fast-paced environments where agility is essential.
3. Scenarios Where PERT Charts May Not Be Ideal
- Simple Projects: For smaller projects with fewer tasks and dependencies, the use of PERT charts may be overkill. Simpler tools, such as Gantt charts or basic task lists, may provide sufficient clarity without the added complexity of a PERT chart.
- Non-linear Projects: In projects where tasks do not follow a linear progression or where there are many interdependencies, PERT charts may not effectively represent the project dynamics. In such cases, alternative methodologies like Agile or Kanban may be more suitable for risk assessment and management.
4. Suggestions for Overcoming Challenges
- Simplification: For large projects, consider breaking down the PERT chart into smaller, more manageable sections. This can help maintain clarity and focus on specific phases of the project without overwhelming stakeholders.
- Regular Reviews: Establish a routine for reviewing and updating the PERT chart. This can involve setting specific milestones or checkpoints where the chart is assessed and revised as necessary, ensuring that it remains a relevant tool for risk management.
- Complementary Tools: Use PERT charts in conjunction with other project management tools. For instance, integrating Gantt charts for timeline visualization or risk matrices for risk assessment can provide a more comprehensive view of the project landscape.
By acknowledging the challenges and limitations of PERT charts, risk managers and project planners can better navigate their use in project timelines. This understanding allows for more effective risk assessment and enhances overall project success.
Conclusion: The Future of PERT Charts in Project Management
As we look towards the future of project management, it is essential to recognize the pivotal role that PERT (Program Evaluation and Review Technique) charts play in effective risk management strategies. These visual tools not only facilitate the mapping of project timelines but also enhance the ability to identify, assess, and mitigate risks throughout the project lifecycle. Here are some key takeaways and forward-looking perspectives on the integration of PERT charts in project management:
- Integration in Risk Management Strategies: PERT charts are invaluable for risk managers and project planners as they provide a clear visual representation of project tasks, their interdependencies, and potential bottlenecks. By integrating PERT charts into risk management strategies, teams can proactively identify critical paths and allocate resources more effectively, thereby minimizing the impact of unforeseen challenges. This integration is crucial for maintaining project timelines and ensuring successful outcomes.
- Ongoing Education and Adaptation: The landscape of project management is continuously evolving, driven by advancements in technology and changing methodologies. It is imperative for risk managers and project planners to engage in ongoing education regarding the latest tools and techniques, including the use of PERT charts. By staying informed and adaptable, professionals can leverage these charts to enhance their risk assessment processes and improve overall project performance.
- Future Trends in Project Management: As project management continues to evolve, several trends are likely to shape the future role of PERT charts. The increasing adoption of agile methodologies may lead to the integration of PERT charts with other project management tools, such as Gantt charts and Kanban boards, creating hybrid approaches that offer greater flexibility and responsiveness. Additionally, the rise of artificial intelligence and data analytics will enable more sophisticated risk assessments, allowing PERT charts to incorporate real-time data and predictive analytics for enhanced decision-making.
In conclusion, PERT charts will remain a cornerstone of effective project management, particularly in the realm of risk management. By embracing these tools and adapting to emerging trends, risk managers and project planners can navigate the complexities of project timelines with greater confidence and success. The future of PERT charts is bright, and their continued evolution will undoubtedly contribute to more resilient and efficient project management practices.
Find out more about Shaun Stoltz https://www.shaunstoltz.com/about/.
This post was written by an AI and reviewed/edited by a human.