Introduction to Visual Project Management
Visual tools have become indispensable for effectively planning, executing, and monitoring projects. Visual project management refers to the use of graphical representations to convey project information, making it easier for teams to understand complex data and workflows. This approach is particularly relevant in today’s fast-paced environment, where clarity and quick comprehension are paramount. By leveraging visual tools, project managers can enhance communication, foster collaboration, and ensure that all team members are aligned with project goals.
Benefits of Using Visual Tools
The integration of visual tools in project management offers several advantages:
- Enhanced Clarity: Visual representations simplify complex information, allowing team members to grasp project details quickly. This clarity reduces misunderstandings and miscommunications, which are common in text-heavy documentation.
- Improved Engagement: Visual tools tend to capture attention more effectively than traditional methods. They encourage active participation from team members, making it easier to discuss progress and challenges.
- Better Tracking and Monitoring: Visual tools like Gantt charts and Work Breakdown Structures (WBS) provide a clear overview of project timelines, tasks, and dependencies. This visibility helps project managers identify potential bottlenecks and adjust plans proactively.
- Facilitated Collaboration: When teams can visualize project components, it fosters a collaborative environment. Team members can easily share insights and updates, leading to more cohesive teamwork.
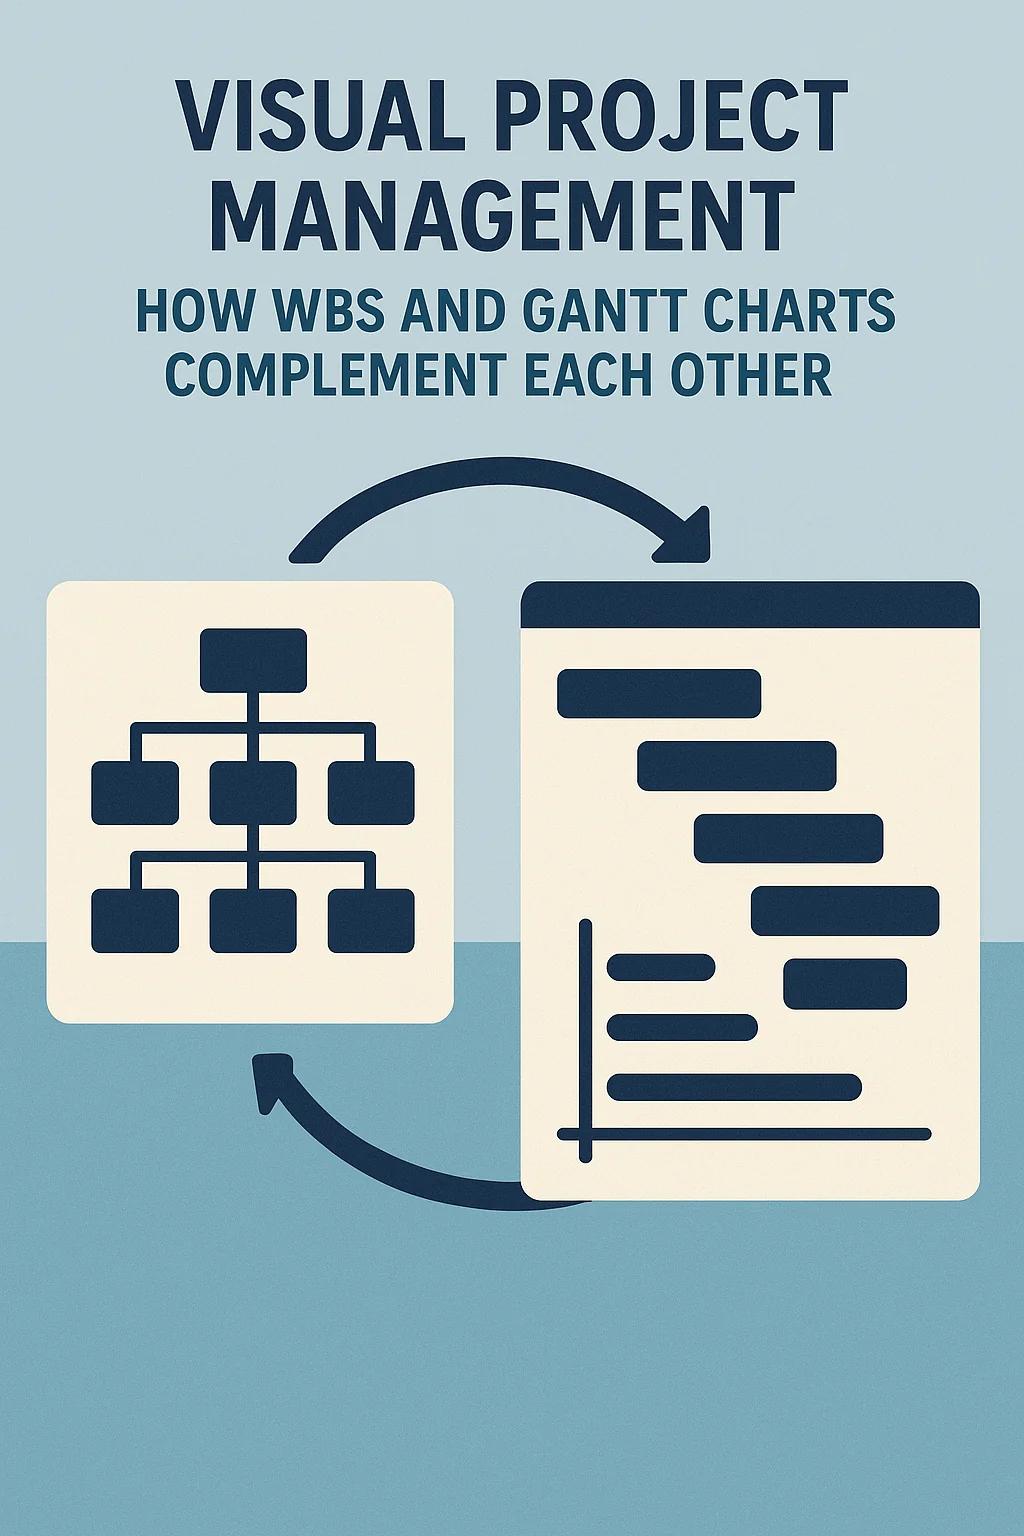
Key Visual Tools: Work Breakdown Structure (WBS) and Gantt Charts
Among the various visual tools available, Work Breakdown Structure (WBS) and Gantt Charts stand out as essential components of effective project management.
- Work Breakdown Structure (WBS): This tool breaks down a project into smaller, manageable components, allowing project managers to organize tasks hierarchically. WBS helps in defining the scope of the project and ensures that all aspects are covered, making it easier to allocate resources and responsibilities.
- Gantt Charts: These charts provide a visual timeline of project tasks, illustrating their start and end dates, as well as dependencies between tasks. Gantt charts are particularly useful for tracking progress and ensuring that the project stays on schedule.
Understanding Work Breakdown Structure (WBS)
A Work Breakdown Structure (WBS) serves as a foundational tool that enhances clarity and organization. It is a hierarchical decomposition of a project into smaller, more manageable components, allowing project managers and teams to visualize the entirety of the project in a structured manner.
Definition and Purpose of WBS
A Work Breakdown Structure is defined as a method for breaking down a project into its constituent parts, which can include deliverables, tasks, and subtasks. The primary purpose of WBS is to facilitate better project planning and execution by providing a clear framework that outlines all necessary work. This structured approach not only aids in understanding the project scope but also ensures that no critical elements are overlooked during the planning phase.
Components of WBS
The WBS is composed of several key components:
- Deliverables: These are the major outputs or results that the project aims to achieve. Deliverables can be tangible products, services, or results that are produced as part of the project.
- Sub-deliverables: These are the smaller components that contribute to the overall deliverables. They help in breaking down the project into more manageable sections, making it easier to assign tasks and responsibilities.
- Work Packages: At the lowest level of the WBS, work packages represent the smallest units of work that can be assigned to a team member or a group. Each work package should be clearly defined, with specific objectives, timelines, and resource requirements.
Benefits of WBS in Project Management
The implementation of a Work Breakdown Structure offers several advantages in project management:
- Task Identification: By breaking down the project into smaller components, WBS allows project managers to identify all necessary tasks and activities required to complete the project. This comprehensive view helps in ensuring that every aspect of the project is accounted for.
- Resource Allocation: WBS facilitates effective resource allocation by clearly defining who is responsible for each task. This clarity helps in assigning the right resources to the right tasks, optimizing team performance and efficiency.
- Project Scope Management: A well-structured WBS aids in managing project scope by providing a clear outline of what is included in the project and what is not. This helps in preventing scope creep, where additional tasks or deliverables are added without proper evaluation and approval.
Exploring Gantt Charts
Gantt charts are essential tools in visual project management, providing a clear and concise way to represent project timelines and tasks. They serve as a visual roadmap, allowing project managers and teams to see the entire project at a glance, which is particularly beneficial for visual learners and creative project managers.
Definition and Significance
A Gantt chart is a type of bar chart that illustrates a project schedule. It displays the start and finish dates of the various elements of a project, making it easier to understand the timeline and the relationships between tasks. The significance of Gantt charts in visual project management lies in their ability to simplify complex project data into an easily digestible format. This visual representation helps teams quickly grasp project timelines, identify potential bottlenecks, and ensure that everyone is aligned on deadlines and deliverables.
Elements of a Gantt Chart
Gantt charts consist of several key elements that contribute to their effectiveness in project management:
- Tasks: Each task or activity required to complete the project is represented as a horizontal bar. The length of the bar indicates the duration of the task.
- Timelines: The horizontal axis of the Gantt chart represents the timeline of the project, typically divided into days, weeks, or months, depending on the project’s length.
- Milestones: Important deadlines or significant points in the project are marked as milestones, often represented by diamond shapes on the chart. These help teams focus on critical achievements.
- Dependencies: Gantt charts also illustrate the relationships between tasks, showing which tasks are dependent on the completion of others. This is crucial for understanding the sequence of activities and managing workflow effectively.
Facilitating Scheduling, Tracking Progress, and Managing Deadlines
Gantt charts play a vital role in scheduling by allowing project managers to allocate resources effectively and set realistic timelines. By visualizing the entire project, teams can identify overlapping tasks and potential resource conflicts, enabling better planning.
Tracking progress is another significant advantage of Gantt charts. As tasks are completed, project managers can update the chart to reflect the current status, making it easy to see which tasks are on track and which may be falling behind. This real-time visibility helps teams make informed decisions and adjustments as needed.
Finally, Gantt charts are instrumental in managing deadlines. By clearly displaying timelines and milestones, they help ensure that all team members are aware of their responsibilities and the overall project schedule. This transparency fosters accountability and encourages timely completion of tasks, ultimately leading to successful project delivery.
WBS vs Gantt Charts: Key Differences
Work Breakdown Structures (WBS) and Gantt Charts are two essential tools that serve distinct yet complementary purposes. Understanding their differences can enhance the effectiveness of project planning, especially for visual learners and creative project managers.
1. Focus on Task Breakdown vs. Time Management
- Work Breakdown Structure (WBS): The primary focus of a WBS is to decompose a project into smaller, manageable components. It emphasizes the breakdown of tasks into subtasks, allowing project managers to clearly define the scope of work. This hierarchical structure helps in identifying all necessary deliverables and ensures that no aspect of the project is overlooked. By organizing tasks into a tree-like format, WBS provides clarity on how each task contributes to the overall project objectives.
- Gantt Chart: In contrast, Gantt Charts prioritize time management. They visually represent the project schedule, displaying tasks along a timeline. Each task is represented as a horizontal bar, with the length of the bar indicating the duration of the task. This focus on time allows project managers to track progress, identify dependencies, and manage deadlines effectively. Gantt Charts are particularly useful for visualizing the sequence of tasks and understanding how they overlap.
2. Visual Representation Differences
- Hierarchical Structure of WBS: The WBS is characterized by its hierarchical format, which organizes tasks in a top-down manner. This structure allows project managers to see the relationship between tasks and their subtasks, making it easier to understand the project’s scope. The visual representation of a WBS often resembles a family tree, where each branch represents a different level of task breakdown. This clarity is beneficial for team members who need to grasp the overall project structure quickly.
- Timeline Orientation of Gantt Charts: Gantt Charts, on the other hand, are oriented along a timeline, providing a linear view of project tasks. This format allows project managers to see when tasks start and finish, as well as how they relate to one another in terms of scheduling. The visual layout of a Gantt Chart is particularly effective for tracking progress over time, as it highlights completed tasks and upcoming deadlines. This timeline perspective is crucial for ensuring that the project stays on track.
3. Distinct Yet Complementary Purposes
- Distinct Roles: While WBS and Gantt Charts serve different functions, they are not mutually exclusive. The WBS is instrumental in the initial stages of project planning, where defining the scope and breaking down tasks is essential. It provides a foundation for understanding what needs to be done. Conversely, Gantt Charts come into play during the scheduling phase, where the focus shifts to when tasks will be completed and how they will be coordinated.
- Complementary Use: Together, these tools create a comprehensive project management framework. A well-structured WBS can inform the development of a Gantt Chart by ensuring that all tasks are accounted for and appropriately sequenced. By using both tools in tandem, project managers can enhance their planning and execution processes, leading to more successful project outcomes. Visual learners and creative project managers can particularly benefit from this synergy, as it allows them to engage with the project from both a structural and temporal perspective.
The Synergy Between WBS and Gantt Charts
Visual tools play a crucial role in enhancing clarity and communication. Two of the most effective visual project management tools are the Work Breakdown Structure (WBS) and Gantt Charts. Understanding how these tools complement each other can significantly improve project outcomes, especially for visual learners and creative project managers.
How WBS Informs the Creation of a Gantt Chart
The Work Breakdown Structure serves as the foundational blueprint for any project. It breaks down the project into smaller, manageable components, detailing tasks, deliverables, and milestones. This hierarchical decomposition allows project managers to:
- Identify Tasks: WBS helps in clearly defining all the tasks required to complete the project. By outlining these tasks, project managers can ensure that no critical elements are overlooked.
- Establish Relationships: WBS facilitates the identification of dependencies between tasks. Understanding which tasks must be completed before others can begin is essential for effective scheduling.
- Set Timelines: Once the tasks are identified, they can be translated into a Gantt Chart, where each task is assigned a specific timeline. This visual representation allows project managers to see the project’s overall timeline at a glance, making it easier to manage deadlines and resources.
By using WBS as a precursor to Gantt Charts, project managers can create a more structured and organized approach to project planning, ensuring that all aspects of the project are accounted for and scheduled appropriately.
The Iterative Process of Updating Both Tools
Project management is inherently dynamic, requiring continuous adjustments and updates. Both WBS and Gantt Charts are living documents that should evolve throughout the project lifecycle. This iterative process includes:
- Regular Reviews: As the project progresses, it is essential to regularly review and update the WBS to reflect any changes in scope or task completion. This ensures that the project remains aligned with its goals.
- Adjusting Timelines: Changes in task duration or resource availability necessitate updates to the Gantt Chart. By revisiting the WBS, project managers can adjust timelines based on the current status of tasks, ensuring that the project remains on track.
- Enhanced Communication: Keeping both tools updated fosters better communication among team members. Everyone can see the current status of tasks and timelines, which helps in coordinating efforts and addressing potential issues proactively.
This iterative updating process not only keeps the project organized but also enhances team collaboration and accountability.
Examples of Improved Project Outcomes
Utilizing both WBS and Gantt Charts together can lead to significant improvements in project outcomes. Here are a few examples:
- Increased Clarity: A marketing team launching a new product used a WBS to outline all necessary tasks, from market research to promotional activities. By translating this into a Gantt Chart, they were able to visualize the timeline and dependencies, leading to a successful launch on schedule.
- Better Resource Management: In a construction project, the project manager used WBS to detail all phases of construction. The Gantt Chart helped in allocating resources effectively, ensuring that labor and materials were available when needed, which minimized delays and cost overruns.
- Enhanced Risk Management: A software development team employed both tools to track progress and identify potential bottlenecks. By regularly updating the WBS and Gantt Chart, they were able to anticipate risks and implement mitigation strategies, resulting in a smoother development process.
Best Practices for Using WBS and Gantt Charts
Work Breakdown Structures (WBS) and Gantt Charts are two powerful visual tools that, when used together, can significantly enhance project planning and execution. Here are some best practices to effectively utilize these tools, ensuring they align with project goals and facilitate clear communication among team members.
Guidelines for Creating an Effective WBS
- Define Project Objectives Clearly: Start by outlining the main goals of the project. This clarity will guide the breakdown of tasks and ensure that every component of the WBS aligns with the overall project objectives.
- Break Down Deliverables: Decompose the project into smaller, manageable components. Each level of the WBS should represent a more detailed breakdown of tasks, making it easier to assign responsibilities and track progress.
- Use a Hierarchical Structure: Organize the WBS in a hierarchical format, where the top level represents the project as a whole, and subsequent levels detail the deliverables and tasks. This structure helps in visualizing the relationship between different components of the project.
- Involve the Team: Engage team members in the creation of the WBS. Their insights can help identify tasks that may be overlooked and foster a sense of ownership over the project.
- Review and Revise: Regularly review the WBS to ensure it remains relevant as the project evolves. Adjustments may be necessary to accommodate changes in scope or objectives.
Tips for Designing an Informative Gantt Chart
- Keep It Simple: Design the Gantt Chart to be straightforward and uncluttered. Use clear labels and a logical layout to make it easy for all stakeholders to understand the project timeline at a glance.
- Use Color Coding: Implement color coding to differentiate between various tasks, phases, or team members. This visual distinction can help quickly identify the status of different components of the project.
- Include Milestones: Clearly mark key milestones on the Gantt Chart. This not only highlights important deadlines but also helps in tracking progress and maintaining motivation among team members.
- Update Regularly: Ensure that the Gantt Chart is updated frequently to reflect the current status of tasks. This practice keeps everyone informed and allows for timely adjustments to the project plan.
- Integrate with Other Tools: Consider using project management software that allows for integration between the WBS and Gantt Chart. This can streamline updates and provide a cohesive view of project progress.
Encourage Regular Reviews and Adjustments
- Schedule Regular Check-Ins: Establish a routine for reviewing both the WBS and Gantt Chart. These check-ins can help identify any discrepancies between planned and actual progress, allowing for timely interventions.
- Be Flexible: Encourage a culture of adaptability within the team. As projects evolve, being open to revising the WBS and Gantt Chart will help maintain alignment with project goals and stakeholder expectations.
- Solicit Feedback: After each review, gather feedback from team members on the effectiveness of the WBS and Gantt Chart. This input can provide valuable insights for future projects and enhance the overall project management process.
By following these best practices, project managers can leverage the strengths of both Work Breakdown Structures and Gantt Charts, creating a synergistic approach to visual project management that caters to the needs of visual learners and creative project managers alike.
Conclusion
The Work Breakdown Structure (WBS) and Gantt charts serve as indispensable tools that, when used together, create a powerful synergy.
- Complementary Nature: The WBS provides a detailed breakdown of project deliverables, allowing project managers to visualize the scope and structure of the project. It helps in identifying all tasks and subtasks, ensuring that nothing is overlooked. On the other hand, Gantt charts offer a timeline view, illustrating how these tasks interconnect and progress over time. This dual approach not only enhances understanding but also facilitates better planning and resource allocation.
- Enhanced Clarity and Efficiency: By embracing both the WBS and Gantt charts, project managers can achieve greater clarity in their projects. The WBS lays the groundwork by defining what needs to be done, while the Gantt chart provides a roadmap for when and how these tasks will be executed. This combination allows for more efficient tracking of progress and adjustments as needed, ultimately leading to successful project outcomes.
In summary, the integration of WBS and Gantt charts not only enhances project clarity and efficiency but also empowers project managers to navigate the complexities of their projects with confidence. Embrace these tools to elevate your project management practices and drive your projects to success.
Find out more about Shaun Stoltz https://www.shaunstoltz.com/about/.
This post was written by an AI and reviewed/edited by a human.