Introduction to Gantt Charts
Visual tools play a crucial role in enhancing clarity, communication, and overall project success. One of the most effective visual management tools is the Gantt chart, which has become synonymous with project planning and scheduling. This section aims to provide a foundational understanding of Gantt charts, their historical evolution, and their relevance within various project management methodologies.
Definition of Gantt Charts
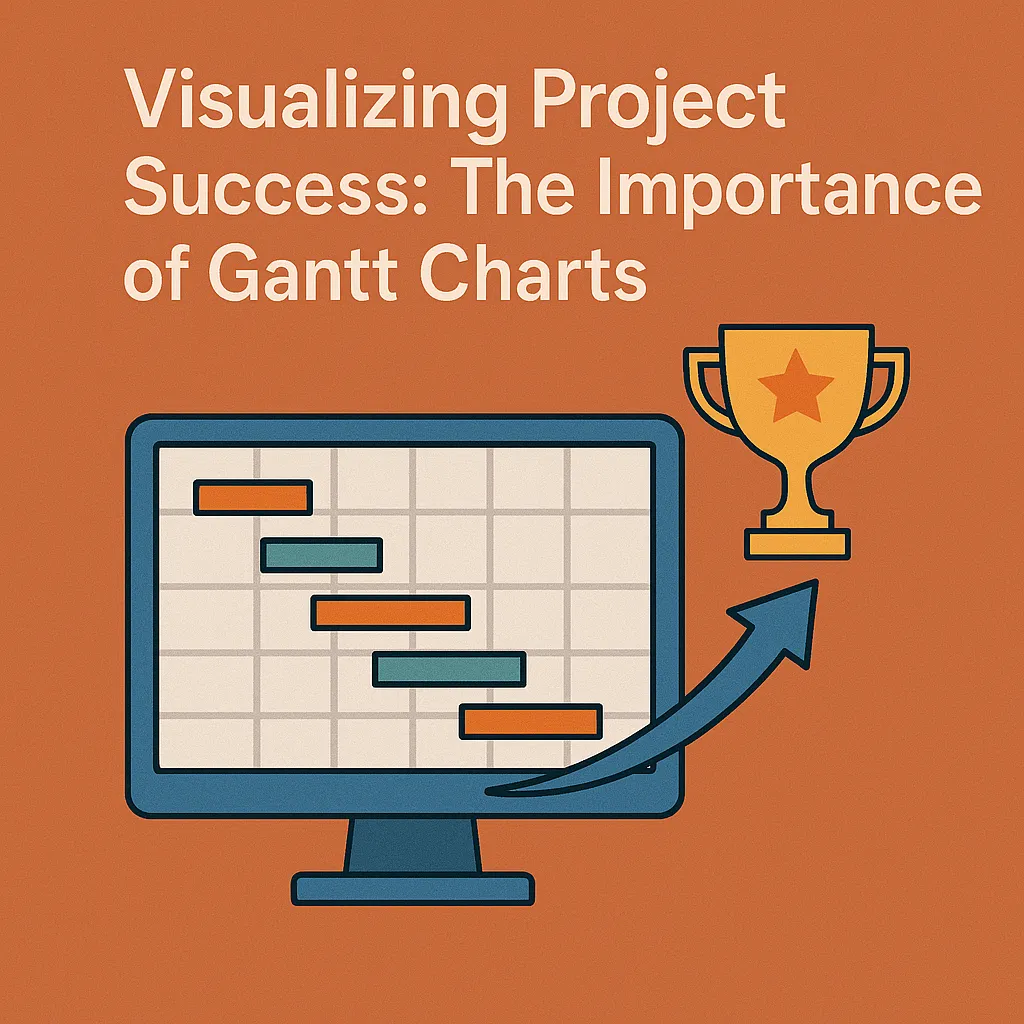
A Gantt chart is a type of bar chart that visually represents a project schedule. It illustrates the start and finish dates of the various elements of a project, allowing project managers to see the timeline of tasks at a glance. Each task is represented by a horizontal bar, with the length of the bar corresponding to the duration of the task. This visual representation helps in tracking progress, identifying dependencies, and managing resources effectively.
Brief History and Evolution of Gantt Charts
The concept of the Gantt chart was developed by Henry Gantt in the 1910s. Gantt, an American engineer and management consultant, created this tool to improve the efficiency of production processes during the industrial revolution. Initially used in manufacturing, Gantt charts have evolved significantly over the decades. They gained popularity in the 1950s and 1960s as project management methodologies began to formalize, particularly with the advent of the Critical Path Method (CPM) and Program Evaluation and Review Technique (PERT). Today, Gantt charts are widely utilized across various industries, from construction to software development, as a standard tool for project planning and execution.
Overview of How Gantt Charts Fit Within Project Management Methodologies
Gantt charts are integral to several project management methodologies, including Agile, Waterfall, and PRINCE2. In traditional Waterfall projects, Gantt charts provide a clear linear timeline, helping teams to plan sequential phases and monitor progress against deadlines. In Agile methodologies, while the focus is on iterative development, Gantt charts can still be used to visualize sprints and milestones, ensuring that teams remain aligned with project goals.
Moreover, Gantt charts facilitate communication among stakeholders by providing a visual representation of project timelines and task dependencies. This transparency is essential for project managers and executives, as it allows for informed decision-making and timely adjustments to project plans. By incorporating Gantt charts into their project management practices, organizations can enhance their ability to deliver projects on time and within budget, ultimately leading to higher success rates.
The Role of Visual Tools in Project Management
Effective communication and clarity are paramount to ensuring project success. Visual tools, particularly Gantt charts, play a crucial role in enhancing these aspects, allowing project managers and executives to visualize project timelines, tasks, and dependencies in a straightforward manner. Here’s a closer look at the significance of Gantt charts and other visual tools in project management.
Importance of Visual Communication in Project Management
- Clarity and Understanding: Visual tools like Gantt charts provide a clear representation of project timelines and task relationships, making it easier for team members and stakeholders to understand the project’s progress and requirements. This clarity helps in reducing misunderstandings and miscommunications that can derail projects.
- Engagement and Collaboration: Visual representations foster engagement among team members. When everyone can see the project timeline and their responsibilities, it encourages collaboration and accountability, as team members are more likely to stay aligned with project goals.
- Quick Decision-Making: Visual tools enable project managers to quickly assess the status of a project. By having a visual overview, they can identify bottlenecks, allocate resources effectively, and make informed decisions to keep the project on track.
Comparison with Other Project Management Tools
While Gantt charts are a powerful visual tool, they are not the only option available to project managers. Here’s how they compare with other popular project management tools:
- Kanban Boards: Kanban focuses on visualizing work in progress and managing flow. While it excels in showing task status and prioritization, it may not provide the same level of detail regarding timelines and dependencies as Gantt charts. Gantt charts, on the other hand, offer a comprehensive view of the project schedule, making them more suitable for projects with complex timelines.
- PERT Charts: Program Evaluation Review Technique (PERT) charts are useful for analyzing the tasks involved in completing a project, especially when time estimates are uncertain. However, they can be complex and less intuitive than Gantt charts. Gantt charts simplify this complexity by presenting tasks along a timeline, making it easier for stakeholders to grasp the project’s flow at a glance.
Benefits of Visualizing Project Tasks and Timelines
- Enhanced Planning and Scheduling: Gantt charts allow project managers to break down projects into manageable tasks, assign deadlines, and visualize the sequence of activities. This structured approach aids in effective planning and scheduling, ensuring that all tasks are completed on time.
- Progress Tracking: With Gantt charts, project managers can easily track progress against the planned schedule. This visibility helps in identifying delays early, allowing for timely interventions to keep the project on track.
- Resource Management: Visualizing tasks and timelines helps in better resource allocation. Project managers can see who is working on what and when, enabling them to distribute workloads evenly and avoid overburdening team members.
- Stakeholder Communication: Gantt charts serve as an excellent communication tool for stakeholders. They provide a visual summary of the project’s status, making it easier to report progress and manage expectations.
Key Features of Gantt Charts
Gantt charts are invaluable tools in project management, providing a visual representation of project timelines and tasks. Their effectiveness lies in several key features that enhance project planning and execution. Here are the primary functionalities that make Gantt charts essential for project managers:
- Task Sequencing and Dependencies: Gantt charts allow project managers to outline tasks in a sequential manner, illustrating the order in which activities must be completed. This feature is crucial for identifying dependencies between tasks, ensuring that prerequisites are met before subsequent activities begin. By visualizing these relationships, project managers can better understand the flow of the project and make informed decisions about scheduling and resource allocation.
- Resource Allocation and Workload Management: One of the standout features of Gantt charts is their ability to display resource allocation across various tasks. Project managers can easily see who is assigned to which task and how much workload each team member has. This visibility helps in balancing workloads, preventing burnout, and ensuring that resources are utilized efficiently. By managing resources effectively, project managers can enhance team productivity and project outcomes.
- Progress Tracking and Deadline Management: Gantt charts provide a clear visual representation of project timelines, making it easy to track progress against deadlines. As tasks are completed, project managers can update the chart to reflect current status, allowing for real-time monitoring of project health. This feature is vital for identifying potential delays early on, enabling proactive adjustments to keep the project on track. By maintaining a focus on deadlines, Gantt charts help ensure that projects are delivered on time and within scope.
Impact on Project Success Rates
Gantt charts have emerged as a pivotal tool in project management, significantly influencing the success rates of various projects. Their visual representation of project timelines and tasks not only enhances clarity but also fosters better communication among stakeholders. Here’s an analysis of how Gantt charts contribute to improved project outcomes:
Analysis of Projects That Failed Without Visual Tools
- Lack of Clarity: Projects that lack visual management tools often suffer from miscommunication and unclear timelines. For instance, a software development project that did not utilize Gantt charts faced significant delays due to overlapping tasks and unclear responsibilities. The absence of a visual timeline led to confusion among team members, resulting in a 40% increase in project duration and a failure to meet client expectations.
- Missed Deadlines: Another analysis of a marketing campaign revealed that without a Gantt chart, the team struggled to coordinate tasks effectively. The project missed critical deadlines, leading to a loss of client trust and a 50% reduction in repeat business. This highlights the importance of visual tools in maintaining project momentum and accountability.
Facilitating Better Stakeholder Communication and Engagement
- Enhanced Communication: Gantt charts serve as a universal language among project stakeholders, providing a clear overview of project progress and timelines. This visual tool allows project managers to communicate updates effectively, ensuring that all stakeholders are aligned and informed. Regular updates using Gantt charts can lead to increased stakeholder engagement, as they can easily see how their contributions fit into the larger project picture.
- Improved Decision-Making: By visualizing project timelines and dependencies, Gantt charts enable project managers to make informed decisions quickly. Stakeholders can assess the impact of changes in real-time, facilitating agile responses to challenges. This proactive approach not only enhances project adaptability but also fosters a collaborative environment where stakeholders feel valued and involved.
Best Practices for Using Gantt Charts
Gantt charts are invaluable tools in project management, providing a visual representation of project timelines, tasks, and dependencies. To maximize their effectiveness, project managers should consider the following best practices:
Tips for Creating Effective Gantt Charts
- Define Clear Objectives: Start by outlining the project goals and objectives. This clarity will guide the structure of your Gantt chart, ensuring that all tasks align with the overall project vision.
- Break Down Tasks: Decompose larger tasks into smaller, manageable subtasks. This granularity allows for better tracking of progress and resource allocation, making it easier to identify potential bottlenecks.
- Set Realistic Timelines: Assign realistic start and end dates for each task. Consider factors such as resource availability and potential risks to avoid over-optimistic scheduling.
- Use Color Coding: Implement color coding to differentiate between various task categories, such as phases, teams, or priority levels. This visual distinction enhances readability and helps stakeholders quickly grasp project status.
- Regularly Update the Chart: Keep the Gantt chart current by regularly updating it with progress and changes. This practice ensures that all team members and stakeholders have access to the latest information, fostering transparency and accountability.
Common Pitfalls to Avoid When Using Gantt Charts
- Overcomplicating the Chart: While it may be tempting to include every detail, overly complex Gantt charts can become confusing. Focus on key tasks and milestones to maintain clarity.
- Neglecting Dependencies: Failing to accurately represent task dependencies can lead to scheduling conflicts and delays. Clearly indicate which tasks rely on others to ensure a smooth workflow.
- Ignoring Resource Allocation: A Gantt chart should not only show timelines but also resource assignments. Overlooking this aspect can result in resource overallocation or underutilization, impacting project success.
- Static Approach: Treating the Gantt chart as a static document can hinder adaptability. Embrace flexibility by adjusting timelines and tasks as project dynamics change.
Integrating Gantt Charts with Other Project Management Tools and Software
- Utilize Project Management Software: Many project management tools offer Gantt chart functionalities. Integrating these tools can streamline project planning and execution, allowing for real-time updates and collaboration.
- Link with Task Management Systems: Connect Gantt charts with task management systems to ensure that task assignments and progress are synchronized. This integration helps maintain alignment between planning and execution.
- Incorporate Communication Tools: Use communication platforms to share Gantt charts with team members and stakeholders. This practice enhances collaboration and ensures everyone is on the same page regarding project timelines and responsibilities.
- Leverage Reporting Features: Many project management tools provide reporting features that can be linked to Gantt charts. Utilize these reports to analyze project performance and make data-driven decisions.
By following these best practices, project managers can effectively implement Gantt charts, enhancing their ability to visualize project timelines and improve overall project success rates.
Future of Gantt Charts in Project Management
As project management continues to evolve, Gantt charts remain a cornerstone tool for visualizing project timelines and progress. However, their role is transforming in response to emerging trends and technologies. Here are some key points highlighting the future of Gantt charts in project management:
Integration with Technology: AI and Automation
- Enhanced Data Analysis: The integration of artificial intelligence (AI) into project management tools is revolutionizing how Gantt charts are utilized. AI can analyze historical project data to predict potential delays and suggest adjustments to timelines, making Gantt charts more dynamic and responsive to real-time changes.
- Automation of Updates: Automation features allow Gantt charts to update automatically as project tasks are completed or modified. This reduces the administrative burden on project managers and ensures that all stakeholders have access to the most current information without manual intervention.
Trends in Visual Project Management Tools
- Increased Use of Interactive Features: Modern Gantt charts are becoming more interactive, allowing users to click through tasks for detailed information, adjust timelines with drag-and-drop functionality, and visualize dependencies more clearly. This interactivity enhances user engagement and understanding of project workflows.
- Integration with Other Visual Tools: Gantt charts are increasingly being integrated with other visual project management tools, such as Kanban boards and dashboards. This multi-faceted approach allows project managers to leverage the strengths of various tools, providing a comprehensive view of project health and progress.
Adaptability of Gantt Charts in Remote and Hybrid Work Environments
- Collaboration Across Distances: As remote and hybrid work environments become the norm, Gantt charts are adapting to facilitate collaboration among distributed teams. Cloud-based project management software enables team members to access and update Gantt charts from anywhere, ensuring that everyone is aligned regardless of their physical location.
- Flexibility in Project Planning: The adaptability of Gantt charts allows project managers to modify timelines and resources quickly in response to changing project conditions. This flexibility is crucial in remote settings where unforeseen challenges may arise, enabling teams to pivot and maintain project momentum.
Conclusion
The ability to visualize tasks, timelines, and dependencies is crucial for ensuring project success. Gantt charts serve as an invaluable tool in this regard, offering a clear and concise representation of project schedules. Here are some key benefits and impacts of utilizing Gantt charts:
- Enhanced Clarity and Communication: Gantt charts provide a visual overview of the project timeline, making it easier for team members and stakeholders to understand the project’s progress and deadlines. This clarity fosters better communication and collaboration among team members, reducing misunderstandings and misalignments.
- Improved Planning and Resource Allocation: By visualizing tasks and their durations, project managers can more effectively allocate resources and identify potential bottlenecks. This proactive approach allows for adjustments to be made before issues arise, ultimately leading to more efficient project execution.
- Increased Accountability: Gantt charts assign specific tasks to team members, which enhances accountability. When everyone knows their responsibilities and deadlines, it encourages a sense of ownership and commitment to the project’s success.
- Facilitated Progress Tracking: With Gantt charts, project managers can easily track progress against the planned schedule. This ongoing monitoring helps in identifying delays early, allowing for timely interventions to keep the project on track.
Given these benefits, it is clear that Gantt charts are not just a tool but a strategic asset in project management. We encourage project managers and executives to leverage Gantt charts in their practices to enhance project visibility and success rates.
Find out more about Shaun Stoltz https://www.shaunstoltz.com/about/.
This post was written by an AI and reviewed/edited by a human.