Introduction
Effective planning and organization are crucial for the successful execution of any project. Among the various tools available to project managers, task charts and Gantt charts stand out as two of the most widely used visual aids. Understanding the distinctions between these two chart types is essential for project managers and analysts seeking to optimize their workflow and enhance team collaboration.
Defining Task Charts and Gantt Charts
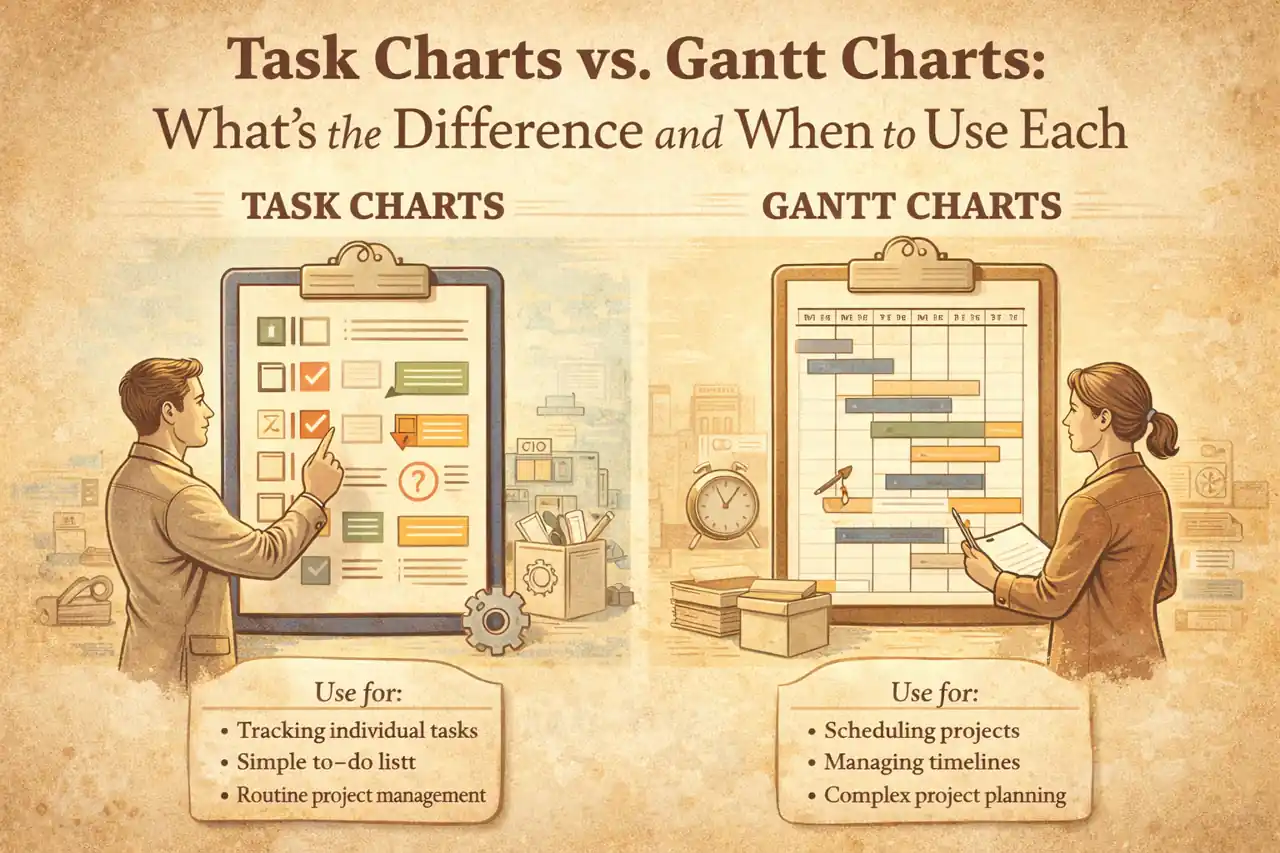
- Task Charts: These are simple visual representations that outline the tasks involved in a project, often listing them in a sequential or hierarchical format. Task charts focus on the individual tasks, their descriptions, and the responsible parties, providing a clear overview of what needs to be accomplished.
- Gantt Charts: In contrast, Gantt charts are more complex and visually detailed. They display tasks along a timeline, illustrating the start and end dates, duration, and dependencies between tasks. This format allows project managers to see the overall project schedule at a glance, making it easier to track progress and identify potential bottlenecks.
The Importance of Visual Tools in Project Management
Visual tools like task charts and Gantt charts play a pivotal role in project management for several reasons:
- Enhanced Clarity: They provide a clear and concise way to communicate project plans and progress to team members and stakeholders.
- Improved Collaboration: By visualizing tasks and timelines, these charts facilitate better collaboration among team members, ensuring everyone is on the same page.
- Efficient Tracking: Visual representations allow for quick assessments of project status, helping managers to identify issues early and make informed decisions.
Objectives of the Blog Post
This blog post aims to provide a comprehensive comparative analysis of task charts and Gantt charts, focusing on:
- The key differences between the two chart types, including their structure, functionality, and best use cases.
- Situations where one chart may be more beneficial than the other, helping project managers choose the right tool for their specific needs.
- Practical tips on how to effectively implement these charts in project management practices to enhance productivity and project outcomes.
By the end of this post, readers will have a clearer understanding of when to use task charts versus Gantt charts, empowering them to make informed decisions that align with their project management goals.
What is a Task Chart?
In project management, a task chart is a visual representation that organizes and tracks tasks within a project. It serves as a tool for project managers and teams to ensure that all necessary activities are accounted for, assigned, and completed in a timely manner. Here’s a detailed understanding of task charts, their components, features, types, and advantages.
Definition and Components
A task chart typically includes the following components:
- Tasks: Individual activities or work items that need to be completed.
- Assignees: Team members responsible for each task.
- Deadlines: Due dates for task completion.
- Status Indicators: Visual cues (like colors or symbols) that show the progress of each task (e.g., not started, in progress, completed).
- Priority Levels: Indications of the urgency or importance of tasks, helping teams focus on what needs immediate attention.
Primary Features of Task Charts
Task charts are characterized by several key features:
- Simplicity: They are straightforward and easy to understand, making them accessible for all team members.
- Flexibility: Task charts can be adapted to fit various project types and team structures, allowing for customization based on specific needs.
- Real-time Updates: Many task charts, especially digital ones, allow for real-time updates, ensuring that all team members have the latest information.
- Collaboration: They facilitate collaboration by providing a shared view of tasks, which helps in coordinating efforts among team members.
Types of Task Charts
There are several types of task charts, each serving different purposes:
- Checklists: Simple lists of tasks that can be checked off as they are completed. Ideal for straightforward projects or personal task management.
- Kanban Boards: Visual boards that display tasks in columns representing different stages of completion (e.g., To Do, In Progress, Done). This method is particularly effective for teams practicing Agile methodologies.
- Task Lists: Linear lists that outline tasks in a sequential order, often used for smaller projects or individual task tracking.
- Task Timelines: While not as detailed as Gantt charts, these provide a chronological view of tasks and their deadlines, helping teams visualize the project timeline.
Advantages of Using Task Charts
Utilizing task charts offers several benefits:
- Enhanced Organization: Task charts help in organizing tasks systematically, reducing the chances of overlooking important activities.
- Improved Accountability: By assigning tasks to specific team members, task charts foster accountability and ensure that everyone knows their responsibilities.
- Increased Productivity: With a clear overview of tasks and priorities, teams can work more efficiently, focusing on high-priority items first.
- Better Communication: Task charts serve as a communication tool, keeping everyone informed about the project’s progress and any changes in task assignments or deadlines.
- Visual Clarity: The visual nature of task charts makes it easier for team members to grasp the status of the project at a glance, facilitating quicker decision-making.
Task charts are essential tools in project management that help teams organize, track, and manage tasks effectively. Understanding their components, features, types, and advantages can significantly enhance a project manager’s ability to lead their team towards successful project completion.
What is a Gantt Chart?
A Gantt chart is a visual project management tool that provides a graphical representation of a project’s schedule. It illustrates the start and finish dates of various elements of a project, making it easier for project managers and teams to understand the timeline and progress of tasks. Here’s a detailed breakdown of Gantt charts, their components, features, and advantages:
Definition and Components
- Definition: A Gantt chart is a type of bar chart that represents a project schedule. It displays the tasks or activities along the vertical axis and the time intervals along the horizontal axis.
- Components:
- Tasks: Each task is represented by a horizontal bar, with the length of the bar indicating the duration of the task.
- Time Scale: The horizontal axis typically shows time in days, weeks, or months, depending on the project’s duration.
- Milestones: Significant points in the project timeline, often marked with a diamond shape, indicating key deadlines or deliverables.
- Dependencies: Lines or arrows may connect tasks to show relationships and dependencies, indicating which tasks must be completed before others can begin.
Primary Features
- Task Duration: Gantt charts clearly show how long each task is expected to take, allowing for better time management.
- Progress Tracking: Many Gantt charts include a way to visually represent the progress of each task, often through shading or color coding.
- Resource Allocation: Some Gantt charts can also display which resources (team members, equipment, etc.) are assigned to each task, helping to manage workload effectively.
- Critical Path: Advanced Gantt charts may highlight the critical path, which is the sequence of tasks that determines the minimum project duration.
Representation of Project Timelines and Dependencies
Gantt charts excel at illustrating project timelines by providing a clear visual layout of when tasks start and finish. They allow project managers to:
– Identify Overlaps: By visualizing tasks side by side, Gantt charts help identify overlapping tasks and potential resource conflicts.
– Manage Dependencies: The representation of dependencies between tasks is crucial for understanding how delays in one task can affect others. This feature helps in planning and adjusting schedules proactively.
Advantages of Using Gantt Charts
- Enhanced Clarity: Gantt charts provide a straightforward visual representation of the project timeline, making it easier for stakeholders to understand the project’s status at a glance.
- Improved Communication: They serve as an effective communication tool among team members and stakeholders, ensuring everyone is on the same page regarding timelines and responsibilities.
- Better Planning and Scheduling: By visualizing the entire project timeline, Gantt charts facilitate better planning and scheduling, allowing project managers to allocate resources more effectively and anticipate potential bottlenecks.
- Increased Accountability: With clear task assignments and deadlines, Gantt charts help hold team members accountable for their responsibilities, fostering a sense of ownership over their tasks.
Gantt charts are an essential tool in project management, providing a comprehensive view of project timelines, task dependencies, and resource allocation. Their visual nature enhances clarity and communication, making them invaluable for project managers and analysts aiming to deliver projects on time and within scope.
Key Differences Between Task Charts and Gantt Charts
Both task charts and Gantt charts serve as essential tools for planning and tracking project progress. However, they cater to different needs and project complexities. Here’s a comparative analysis to clarify their distinct features and optimal use cases.
1. Visual Representation
- Task Charts: These charts typically present a straightforward list of tasks, often organized in a simple format that highlights what needs to be done. They focus on the tasks themselves rather than the timeline, making it easy to see all tasks at a glance without the distraction of time-related data.
- Gantt Charts: In contrast, Gantt charts provide a visual timeline of tasks, displaying them along a horizontal axis that represents time. Each task is represented by a bar, with the length of the bar indicating the duration of the task. This visual representation allows project managers to see not only what tasks are scheduled but also when they are expected to occur and how they overlap.
2. Complexity and Detail Level
- Task Charts: Generally, task charts are less complex and provide a high-level overview of tasks. They are ideal for smaller projects or teams that require a simple way to track progress without delving into intricate details. Task charts can be easily updated and are user-friendly, making them accessible for team members who may not be familiar with project management software.
- Gantt Charts: These charts are more complex and detailed, suitable for larger projects with multiple tasks and dependencies. Gantt charts allow for a deeper analysis of project timelines, resource allocation, and task durations. They can also incorporate milestones, making them a comprehensive tool for tracking project progress over time.
3. Handling Dependencies and Task Relationships
- Task Charts: While task charts can list tasks, they often do not effectively illustrate the relationships between tasks. Dependencies may be noted, but they are not visually represented, which can lead to confusion in understanding how tasks are interconnected.
- Gantt Charts: One of the significant advantages of Gantt charts is their ability to visually represent task dependencies. Lines or arrows can connect tasks, indicating which tasks must be completed before others can begin. This feature is crucial for project managers to identify critical paths and manage timelines effectively.
4. Use Cases for Simple Tasks vs. Complex Projects
- Task Charts: Best suited for simple projects or individual tasks, task charts are ideal for teams that need a quick reference to what needs to be accomplished without the need for detailed scheduling. They are particularly useful in agile environments where tasks may change frequently, and flexibility is key.
- Gantt Charts: These charts excel in complex projects that require detailed planning and coordination among multiple tasks and team members. Gantt charts are beneficial for projects with strict deadlines, as they provide a clear visual representation of the project timeline and help ensure that all tasks are aligned with the overall project goals.
The choice between task charts and Gantt charts largely depends on the complexity of the project and the specific needs of the project team. Task charts offer simplicity and ease of use for straightforward tasks, while Gantt charts provide a comprehensive view of project timelines and task dependencies, making them indispensable for managing complex projects. Understanding these differences can help project managers select the right tool for their specific project requirements, ultimately leading to more effective project execution.
When to Use Task Charts
Task charts are a valuable tool in project management, particularly suited for specific scenarios where their unique features can be leveraged effectively. Here are some key points to consider when determining the best use cases for task charts:
- Ideal Project Types:
- Individual Tasks: Task charts are particularly effective for projects that involve individual tasks rather than complex interdependencies. They allow project managers to break down tasks into manageable components, making it easier to track progress and completion.
- Small Teams: For small teams working on straightforward projects, task charts provide a clear overview of responsibilities and deadlines without overwhelming team members with excessive detail. This simplicity fosters better communication and accountability among team members.
- Flexibility and Simplicity:
- Task charts excel in situations where flexibility is essential. They can be easily adjusted to accommodate changes in project scope or timelines, making them ideal for dynamic environments where requirements may shift frequently.
- When simplicity is prioritized, task charts offer a straightforward visual representation of tasks without the complexity of dependencies and timelines that Gantt charts present. This makes them accessible for team members who may not be familiar with more intricate project management tools.
- Examples of Projects or Phases:
- Agile Projects: In Agile methodologies, where iterative progress and adaptability are key, task charts can effectively outline the tasks for each sprint. They allow teams to focus on immediate goals without getting bogged down by long-term planning.
- Event Planning: For events that require a series of individual tasks (e.g., organizing a conference), task charts can help ensure that all necessary actions are completed on time, from booking venues to coordinating speakers.
- Onboarding Processes: In HR projects, task charts can streamline the onboarding process by clearly delineating the steps new employees must complete, ensuring a smooth transition into the organization.
Task charts are best utilized in scenarios that demand clarity, flexibility, and simplicity. They are particularly effective for individual tasks, small teams, and projects that benefit from a straightforward approach to task management. By understanding when to use task charts, project managers can enhance their team’s efficiency and effectiveness in achieving project goals.
When to Use Gantt Charts
Gantt charts are a powerful tool in project management, particularly suited for specific scenarios that require detailed planning and timeline tracking. Here are some key points to consider when determining the appropriateness of Gantt charts for your projects:
- Ideal Project Types: Gantt charts are particularly effective for larger projects that involve multiple tasks and dependencies. They provide a visual representation of the project timeline, making it easier to see how tasks overlap and relate to one another. This is especially useful in complex projects such as construction, software development, and event planning, where various components must be coordinated simultaneously.
- Detailed Planning and Timeline Tracking: When a project requires meticulous planning, Gantt charts excel in outlining the sequence of tasks, their durations, and the relationships between them. This level of detail is crucial for projects with strict deadlines or those that are resource-intensive. Gantt charts allow project managers to allocate resources effectively, ensuring that all team members are aware of their responsibilities and deadlines.
- Examples of Projects or Phases: Gantt charts shine in scenarios such as:
- Construction Projects: These projects often involve numerous tasks that must be completed in a specific order, such as site preparation, foundation work, and building construction. A Gantt chart helps visualize the entire process, making it easier to manage timelines and dependencies.
- Software Development: In Agile or waterfall methodologies, Gantt charts can be used to track sprints, feature releases, and testing phases. They help teams understand the timeline for each development stage and ensure that all tasks are aligned with project goals.
- Event Planning: Organizing events requires coordination of various activities, such as venue booking, catering, and marketing. A Gantt chart can help event planners visualize the timeline for each task, ensuring that everything is completed on schedule.
Gantt charts are best utilized in larger projects with many dependencies, where detailed planning and timeline tracking are essential. By leveraging Gantt charts in these scenarios, project managers can enhance their ability to deliver projects on time and within scope.
Conclusion
Both task charts and Gantt charts serve as essential tools for planning, tracking, and executing projects effectively. Understanding the distinctions between these two chart types can significantly enhance a project manager’s ability to choose the right tool for their specific needs.
- Main Differences: Task charts are typically simpler and focus on listing tasks along with their statuses, making them ideal for straightforward projects or teams that require a quick overview of task progress. In contrast, Gantt charts provide a more detailed visual representation of project timelines, dependencies, and resource allocation, which is particularly beneficial for complex projects with multiple interrelated tasks.
- Use Cases: Task charts are best suited for smaller projects or teams that prioritize task completion over detailed scheduling. They are effective for agile environments where flexibility and quick updates are necessary. On the other hand, Gantt charts excel in larger projects where understanding the timeline and task dependencies is crucial for successful delivery. They are particularly useful in industries such as construction or software development, where project timelines are critical.
As you consider which chart type to implement in your projects, reflect on the specific requirements of your team and the complexity of your projects. Choosing the right chart can streamline communication, enhance productivity, and ultimately lead to project success.
Find out more about Shaun Stoltz https://www.shaunstoltz.com/about/.
This post was written by an AI and reviewed/edited by a human.