Introduction
Effective planning and execution are crucial for achieving project goals. Two fundamental tools that project managers frequently utilize are the Work Breakdown Structure (WBS) and the Gantt Chart. Understanding the strengths and weaknesses of these tools can significantly impact project success, making it essential for decision-makers and project stakeholders to grasp their functionalities.
Defining Work Breakdown Structure (WBS)
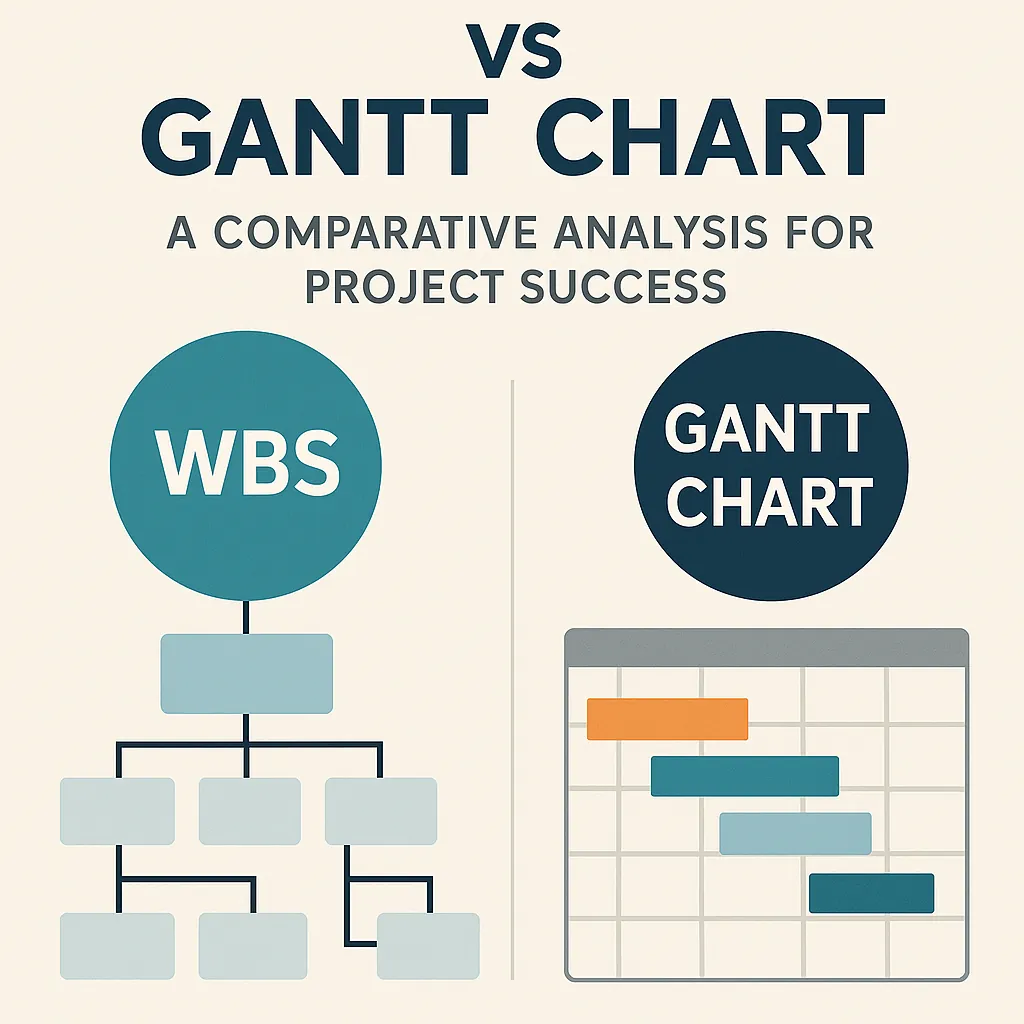
A Work Breakdown Structure (WBS) is a hierarchical decomposition of a project into smaller, more manageable components. It breaks down the overall project into deliverables and tasks, allowing project managers to organize and define the total scope of the project. The WBS serves as a foundation for project planning, resource allocation, and performance measurement, ensuring that all aspects of the project are accounted for.
Defining Gantt Chart
In contrast, a Gantt Chart is a visual representation of a project schedule, illustrating the start and finish dates of various elements of a project. It displays tasks along a timeline, allowing project managers to track progress, identify dependencies, and manage resources effectively. Gantt Charts are particularly useful for visualizing the sequence of tasks and understanding how they overlap, which aids in maintaining project timelines.
Importance in Project Management
Both WBS and Gantt Charts play pivotal roles in project management. The WBS provides a structured approach to project scope management, ensuring that all deliverables are identified and organized. This clarity helps in resource planning and risk management. On the other hand, Gantt Charts enhance communication among stakeholders by providing a clear visual timeline of project activities, which is essential for monitoring progress and making informed decisions.
Purpose of the Comparison
This comparative analysis aims to explore the strengths and weaknesses of WBS and Gantt Charts, providing insights that can help project stakeholders choose the right tool for their specific needs. By understanding how each tool functions and their respective advantages and limitations, decision-makers can enhance their project planning and execution strategies, ultimately leading to greater project success.
Understanding Work Breakdown Structure (WBS)
A Work Breakdown Structure (WBS) is a fundamental project management tool that breaks down a project into smaller, more manageable components. It serves as a visual representation of the project’s scope, allowing project managers and stakeholders to understand the deliverables and tasks required to complete the project successfully. By organizing the project into hierarchical levels, WBS helps in defining the total scope of work, ensuring that all aspects of the project are accounted for and facilitating better planning and execution.
Components of a WBS
The WBS consists of several key components:
- Deliverables: These are the tangible or intangible outcomes that the project aims to produce. Each deliverable is broken down into smaller tasks or sub-deliverables, which can be further divided as necessary.
- Hierarchy: The structure of a WBS is hierarchical, typically represented in a tree-like format. At the top level, the overall project is defined, followed by major deliverables, and then further subdivided into smaller tasks. This hierarchy helps in visualizing the relationship between different components and their contributions to the overall project goals.
Benefits of Using a WBS
Implementing a WBS offers several advantages:
- Clarity: A well-defined WBS provides clarity on project scope and deliverables, ensuring that all team members and stakeholders have a shared understanding of what needs to be accomplished. This clarity helps in reducing misunderstandings and miscommunications throughout the project lifecycle.
- Task Management: By breaking down the project into smaller tasks, a WBS facilitates better task management. Project managers can assign responsibilities, set deadlines, and monitor progress more effectively. This structured approach allows for easier tracking of project milestones and deliverables.
Common Challenges Associated with WBS
Despite its benefits, there are challenges that project managers may face when using a WBS:
- Complexity: As projects grow in size and scope, the WBS can become increasingly complex. Managing a large number of tasks and deliverables can lead to confusion if not organized properly. It requires careful planning and regular updates to maintain its effectiveness.
- Time-Consuming: Developing a comprehensive WBS can be time-consuming, especially for large projects. The initial effort required to identify all deliverables and tasks can be significant, which may deter some project managers from fully utilizing this tool. However, the long-term benefits often outweigh the initial investment of time.
Understanding Gantt Chart
A Gantt Chart is a powerful project management tool that visually represents a project schedule, allowing stakeholders to see the timeline of tasks and their interdependencies. It serves as a graphical illustration of a project’s schedule, making it easier for project managers and teams to plan, coordinate, and track specific tasks within a project.
Definition and Role in Project Scheduling
- Definition: A Gantt Chart is a type of bar chart that illustrates a project schedule. It displays the start and finish dates of the various elements of a project, providing a clear overview of the timeline and progress of tasks.
- Role in Project Scheduling: Gantt Charts play a crucial role in project scheduling by helping project managers allocate resources effectively, set deadlines, and ensure that all team members are aware of their responsibilities and timelines. This visual representation aids in identifying potential bottlenecks and overlaps in tasks, facilitating better planning and execution.
Components of a Gantt Chart
A Gantt Chart typically consists of several key components:
- Tasks: Each task or activity required to complete the project is listed on the vertical axis. This includes all major deliverables and milestones.
- Timelines: The horizontal axis represents the timeline of the project, usually broken down into days, weeks, or months, depending on the project’s duration.
- Dependencies: Arrows or lines may connect tasks to indicate dependencies, showing which tasks must be completed before others can begin. This helps in understanding the sequence of activities and their relationships.
Benefits of Using Gantt Charts
- Visualization: Gantt Charts provide a clear visual representation of the project timeline, making it easier for stakeholders to understand the project’s progress at a glance. This visualization helps in communicating the project status to team members and stakeholders effectively.
- Tracking Progress: By updating the Gantt Chart regularly, project managers can track the progress of tasks against the planned schedule. This allows for timely adjustments and interventions if tasks are falling behind, ensuring that the project stays on track.
Common Challenges Associated with Gantt Charts
While Gantt Charts offer numerous advantages, they also come with certain challenges:
- Over-simplification: Gantt Charts can sometimes oversimplify complex projects. They may not adequately capture the nuances of task interdependencies or the resources required for each task, leading to potential misinterpretations.
- Maintenance: Keeping a Gantt Chart up to date can be time-consuming, especially in dynamic projects where tasks and timelines frequently change. If not maintained properly, the chart can become outdated, leading to confusion and misalignment among team members.
Direct Comparison of WBS and Gantt Chart
In project management, both the Work Breakdown Structure (WBS) and Gantt Chart are essential tools that serve distinct purposes. Understanding their strengths and weaknesses can significantly enhance project planning and execution. Here’s a comparative analysis of these two methodologies:
Clarity and Detail
- Work Breakdown Structure (WBS): The WBS excels in providing a detailed breakdown of tasks and deliverables. It organizes the project into smaller, manageable components, allowing project managers to define specific tasks, responsibilities, and timelines. This level of detail helps in identifying all necessary work and ensures that nothing is overlooked during the planning phase.
- Gantt Chart: In contrast, the Gantt Chart offers a visual timeline of the project. It displays tasks along a horizontal timeline, making it easy to see the duration of each task and how they overlap. While it provides a clear overview of the project schedule, it may lack the granular detail that a WBS offers, potentially leading to oversights in task dependencies or resource allocation.
Planning vs. Execution
- WBS for Planning: The WBS is primarily a planning tool. It helps project managers outline the scope of the project and identify all necessary tasks before execution begins. This structured approach ensures that all aspects of the project are considered, which is crucial for effective resource allocation and risk management.
- Gantt Chart for Execution Tracking: Once the project is underway, the Gantt Chart becomes invaluable for tracking progress. It allows project managers and teams to monitor task completion against the planned schedule, making it easier to identify delays and adjust resources as needed. This real-time tracking is essential for maintaining project momentum and ensuring deadlines are met.
Adaptability
- WBS Adjustments: One of the strengths of the WBS is its adaptability to scope changes. As project requirements evolve, the WBS can be modified to reflect new tasks or changes in deliverables without significant disruption. This flexibility is crucial in dynamic project environments where stakeholder needs may shift.
- Gantt Chart Updates: Conversely, updating a Gantt Chart can be more cumbersome, especially if there are significant changes to the project scope. Adjusting timelines and dependencies may require extensive revisions, which can lead to confusion if not managed carefully. This can hinder the project’s ability to respond quickly to changes.
Team Communication
- WBS for Clarity in Roles: The WBS enhances team communication by clearly defining roles and responsibilities. Each team member knows their specific tasks and how they contribute to the overall project goals. This clarity fosters accountability and collaboration among team members.
- Gantt Chart for Stakeholder Progress: The Gantt Chart serves as an effective communication tool for stakeholders. It visually represents project progress, making it easy for stakeholders to understand where the project stands at any given time. This transparency is vital for maintaining stakeholder engagement and support throughout the project lifecycle.
When to Use WBS vs Gantt Chart
Both Work Breakdown Structures (WBS) and Gantt Charts serve as essential tools, each with unique strengths and weaknesses. Understanding when to utilize each can significantly enhance project planning and execution. Here’s a detailed comparison to guide decision-makers and project stakeholders in selecting the appropriate tool for their specific needs.
Scenarios Best Suited for Work Breakdown Structure (WBS)
- Complex Projects: WBS is particularly effective for large and complex projects that require a detailed breakdown of tasks. It allows project managers to decompose the project into smaller, manageable components, making it easier to assign responsibilities and resources. This structure is beneficial in industries such as construction, software development, and research, where multiple teams may be involved in various aspects of the project.
- Detailed Planning: When a project demands meticulous planning, WBS provides a clear framework for identifying all deliverables and tasks. It helps in visualizing the entire scope of the project, ensuring that no critical elements are overlooked. This is crucial in projects where scope creep is a risk, as it allows for better control and management of project boundaries.
Scenarios Best Suited for Gantt Charts
- Time-Sensitive Projects: Gantt Charts excel in scenarios where time management is critical. They provide a visual timeline of the project, illustrating the start and end dates of tasks, dependencies, and milestones. This makes them ideal for projects with tight deadlines, such as marketing campaigns or product launches, where tracking progress against time is essential.
- Tracking Progress: Gantt Charts are particularly useful for monitoring ongoing projects. They allow project managers to quickly assess the status of various tasks, identify delays, and make necessary adjustments. This real-time tracking capability is vital for ensuring that projects stay on schedule and within budget.
Hybrid Approaches: Combining WBS and Gantt for Comprehensive Project Management
In many cases, a hybrid approach that combines both WBS and Gantt Charts can provide a more comprehensive project management solution. By using WBS to outline the project scope and detailed tasks, project managers can then utilize Gantt Charts to visualize the timeline and track progress. This combination allows for:
- Enhanced Clarity: The WBS provides clarity on what needs to be done, while the Gantt Chart offers a clear view of when tasks should be completed. This dual perspective helps in aligning team efforts with project timelines.
- Improved Resource Allocation: By understanding the detailed tasks through WBS, project managers can allocate resources more effectively on the Gantt Chart, ensuring that the right people are working on the right tasks at the right time.
- Better Risk Management: The integration of both tools allows for better identification of potential risks and bottlenecks. With a clear breakdown of tasks and a visual timeline, project managers can proactively address issues before they escalate.
Conclusion
Both Work Breakdown Structures (WBS) and Gantt Charts serve as invaluable tools, each with distinct strengths and weaknesses that cater to different aspects of project planning and execution.
Strengths and Weaknesses Recap:
- Work Breakdown Structure (WBS):
- Strengths:
- Provides a clear hierarchical breakdown of project deliverables, making it easier to understand the scope and components of the project.
Facilitates better resource allocation and task assignment by clearly defining roles and responsibilities.
- Enhances communication among stakeholders by offering a visual representation of project elements.
- Provides a clear hierarchical breakdown of project deliverables, making it easier to understand the scope and components of the project.
- Weaknesses:
- Can become overly complex for large projects, making it difficult to manage and update.
- Lacks a timeline perspective, which can lead to challenges in tracking progress and deadlines.
- Strengths:
- Gantt Chart:
- Strengths:
- Offers a visual timeline of project tasks, allowing for easy tracking of progress and deadlines.
- Helps in identifying dependencies between tasks, which is crucial for effective scheduling.
- Provides a straightforward way to communicate project timelines to stakeholders.
- Weaknesses:
- Can become cluttered and difficult to read if too many tasks are included, especially in larger projects.
- May not provide sufficient detail on task breakdowns, which can lead to misunderstandings about project scope.
- Strengths:
Evaluating Project Needs:
Before selecting a tool, it is essential for decision-makers and project stakeholders to evaluate their specific project needs. Consider factors such as project size, complexity, and the level of detail required. Understanding these elements will guide you in choosing the most appropriate tool for your project management strategy.
Find out more about Shaun Stoltz https://www.shaunstoltz.com/about/.
This post was written by an AI and reviewed/edited by a human.